Introduction to TradingLite Guides
The TradingLite Guide layers are designed to provide visual aids within your chart. Although purely cosmetic in nature, each Guide layer can be configured to suit your preferences.
Guide Layers
There are two TradingLite Guide layers:
Session Line
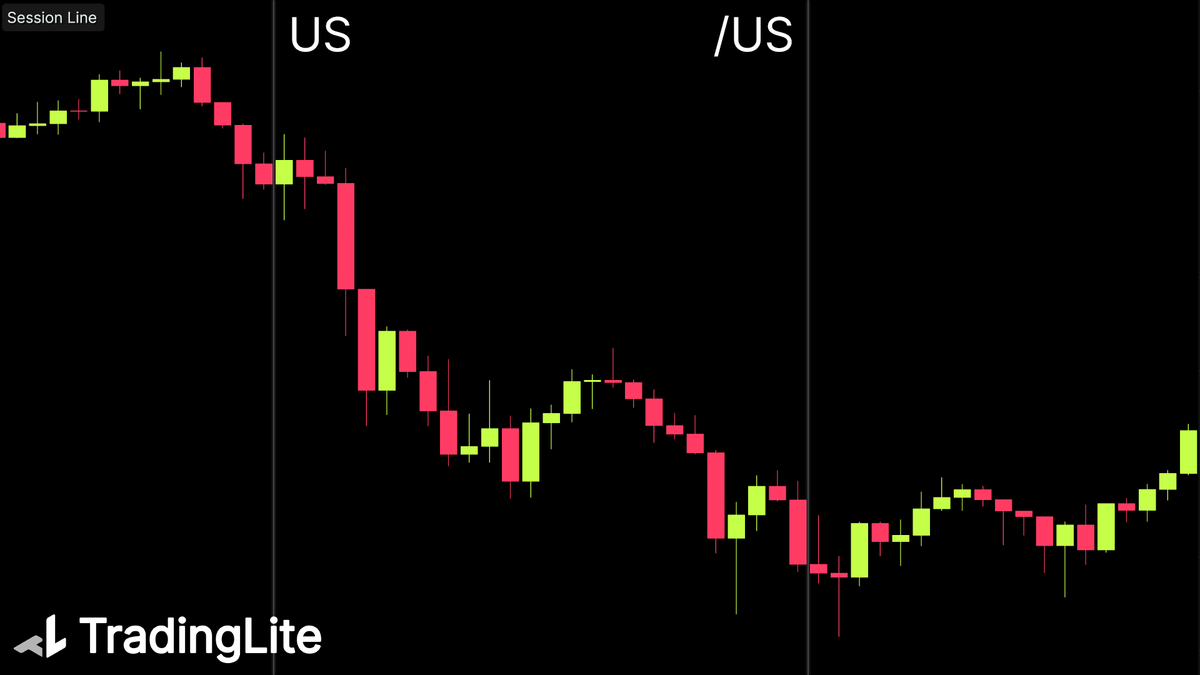
Given the cross-over of crypto market activity with traditional finance market hours, the Session Line Layer is designed to indicate the start and and end of legacy market trading periods. Below is an example of the US Session. The start of the US session is denoted as US, the end; /US.

Grid
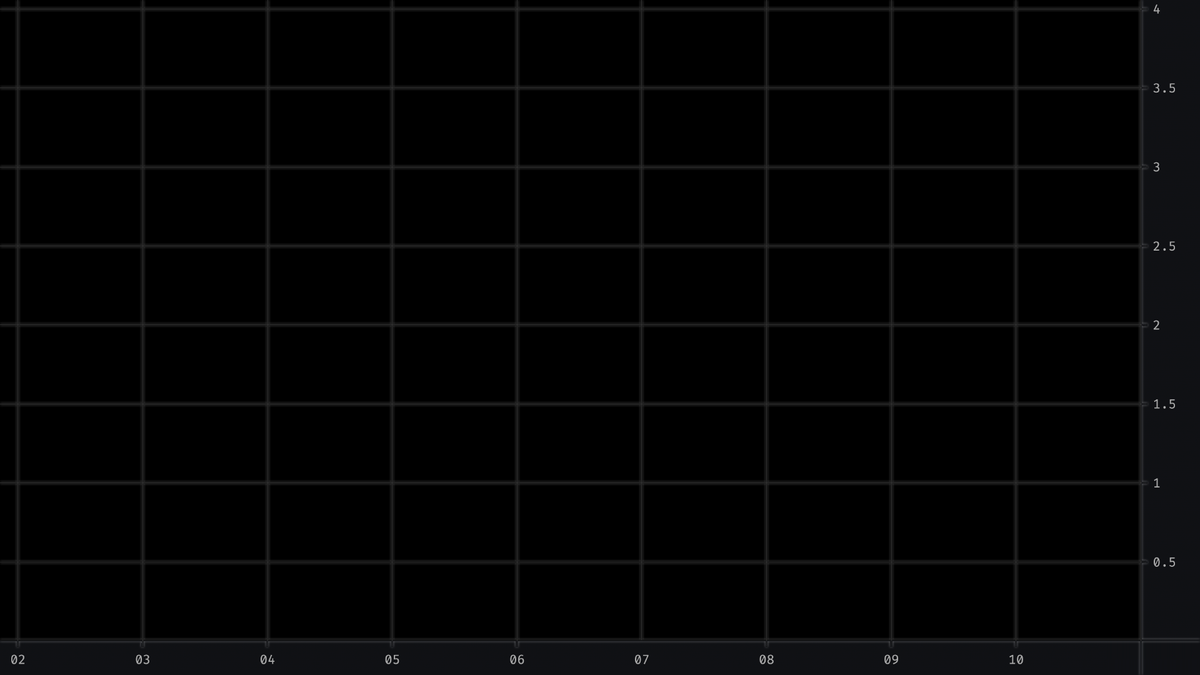
As the name suggests, the Grid layer plots horizontal and vertical lines within the chosen pane. These lines provide visual reference points for time and price. The grid layer is active by default.

Activating Guide Layers
To activate either of the Guide layers, navigate to:
Indicators > Official Indicators > then either:
Session Line
Grid
By default, both Guide layers will be overlaid within the pane displaying price.
Session Line Settings
Session Line Color
Color & Transparency
Session Line Region
You will be able to choose from Asia, Europe and US sessions.
AZ Session - 23:00 - 07:00 (UTC)
EU Session - 07:00 - 15:30 (UTC)
US Session - 13:30 - 20:00 (UTC)
Grid Settings
Grid Toggles
Vertical Line Toggle
Horizontal Line Toggle
Grid Line Color
As the Grid is a core layer, its styling options are located within your Theme Settings.
TradingLite Official Indicators
If you have made it this far into the Guides learn article, you must really love lines... Hopefully you will love all our other Official Indicators as much!
Was this page helpful?