Introduction to Liquidations
Traders that utilize leverage within futures markets must ensure that they maintain enough margin to support their currently open positions. Should the required maintenance margin exceed the equity available within the trader’s account, the exchange will take control and begin to liquidate the position (either incrementally or entirely - depending upon the exchange). The mechanics of how respective trading engines perform the liquidation process, differs between markets and their respective exchanges.
A cascade of liquidations within a short period can at times signal a possible reversal in price. Monitoring real-time exchange published liquidation events, can often provide valuable market analysis.
Activating Liquidations
The official Liquidations Indicator can be added to your chart by navigating to:
Indicators > Official Indicators > Liquidations
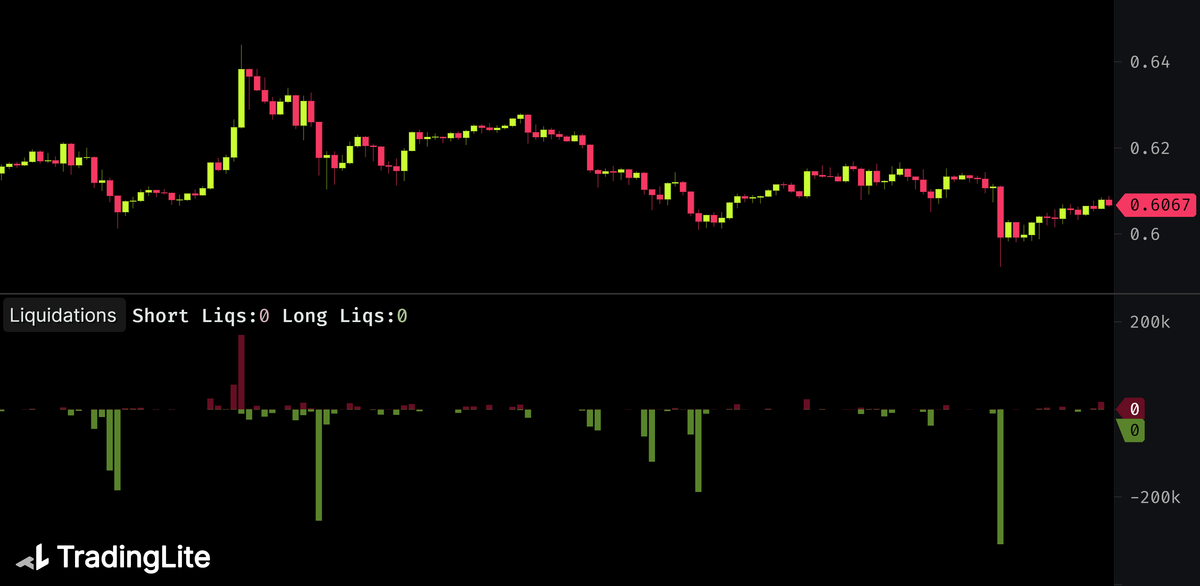
Be default, a new pane will be appended to your chart, with Long and Short Liquidations displayed as a histogram.

By default:
The value of long positions liquidated is shown in Green, below a base of zero
The value of short positions liquidated is shown in Red, above a base of zero
Plot as a histogram, these values are updated in real-time as liquidation events occur. The value of respective long and short liquidations within the candle’s life are totalled to provide the final long & short liquidation prints.
Liquidation Considerations
Spot Markets
Liquidations are only applicable within futures/derivative markets.
Liquidations do not occur within spot markets.
Spot Markets
Liquidations are only applicable within futures/derivative markets.
Liquidations do not occur within spot markets.
Liquidation Settings
Upon activating the Liquidation indicator, you will be able to configure the following styling preferences:
Long Liquidations
Color & Transparency
Short Liquidations
Color & Transparency
Other Futures Indicators
TradingLite provides the full range of derivative data data points available via our Official Indicators. These includes Open Interest, Mark Price, Current & Future Funding Rates.
Open Interest
Mark Price
Current & Future Funding Rates
.
Was this page helpful?