Whilst we recommend users new to TradingLite, to start with this guide, if you’d prefer to a brief overview, please see our Quick Start guide.
Within this guide, you will learn how to use all of the main features within TradingLite.
We strongly suggest having this guide open in one tab, whilst having the TradingLite platform open in another, in order to follow along. If you have not done so already, you can sign up here.
Let’s begin!
Chart Settings
Customisation of your chart window is achieved via the Chart Settings button, at the top of your screen.
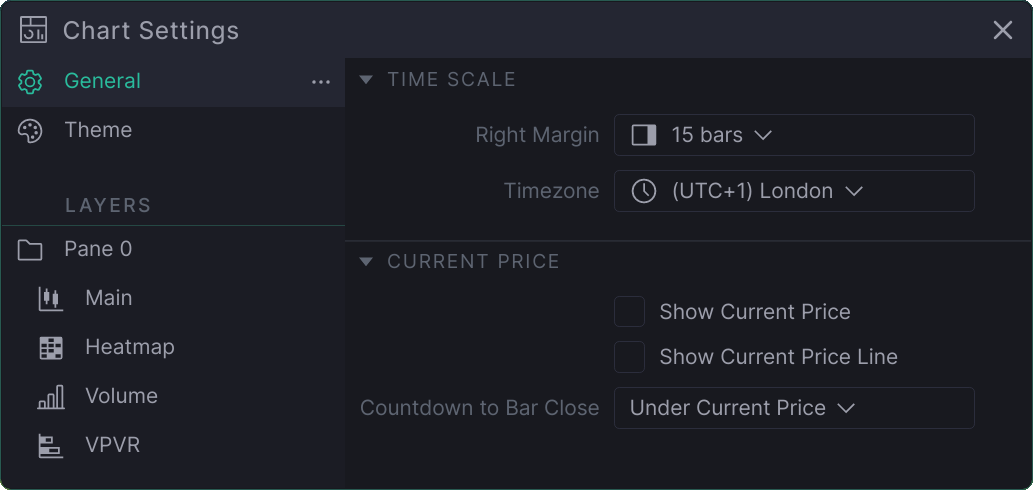
Once here, you will have the ability to organise and configure both Layers and Panes, whilst also customising the look and feel of your charts via the Theme button in the upper left.
General Settings
Right Margin - User definable spacing between current candle and price scale.
Timezone - Select which Timezone is used.
Show Current Price - Show / Hide the current price within the price scale.
Show Current Price Line - Show / Hide the horizontal dashed line, marking the current price.
Countdown to bar close - Show / Hide the countdown timer of the current candle within the price scale.
Layer Settings
To begin to configure each of the layer/indicator’s settings, start by Chart Settings, then clicking on the layer/indicator you wish to customise.
All layers have the ability to toggle:
Visibility - Show / Hide layer visibility within the chart.
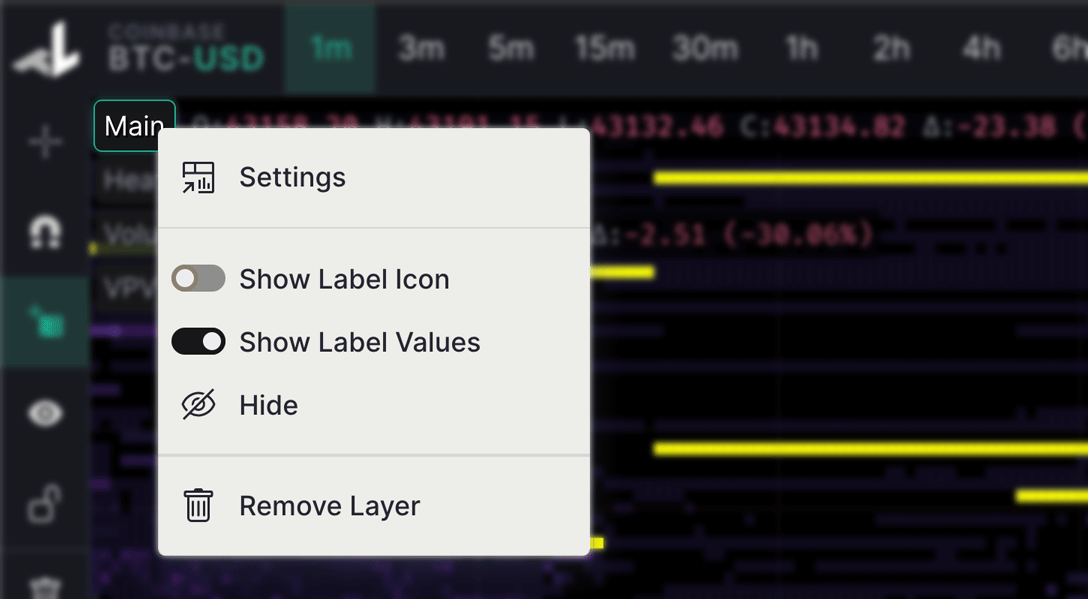
Label options - For more info see below
Settings - Open the layer's settings.
Remove - Remove the layer from the chat.
Custom indicators will also show 'Lit' script icon.
If you are the custom indicator's author, this will open it's LitScript within the in-built code editor, in addition to other script management options.
If you are not the custom indicator's author, this will open it's description.
Layer labels
These labels are shown on the chart, they're composed of either the layer name or layer icon, followed by its latest values ( or from specific time if you're hovering over the chart ).

These handy shortcuts are shown when hovering over its respective label.
As an alternative to clicking the buttons next to the label, you can now right-click the label itself, to access the layer settings.
Drag and Drop Management
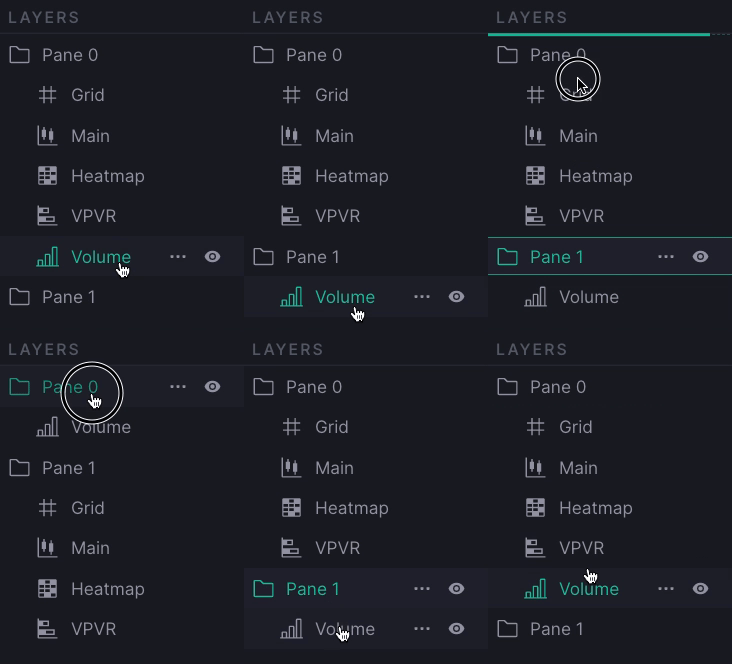 | Within the Chart Settings you have the ability to rearrange your Layers via dragging and dropping. Copy, Cut, Paste, Duplicate and Delete by pressing the 3 dots shown upon hover, or by right clicking on either a pane or layer. |
Layer Context Menus
Right-Clicking the panes and layers within the Chart Settings window allows additional methods of management and cutomization. This menu can also be accessed by clicking the three dots button near one of the items.
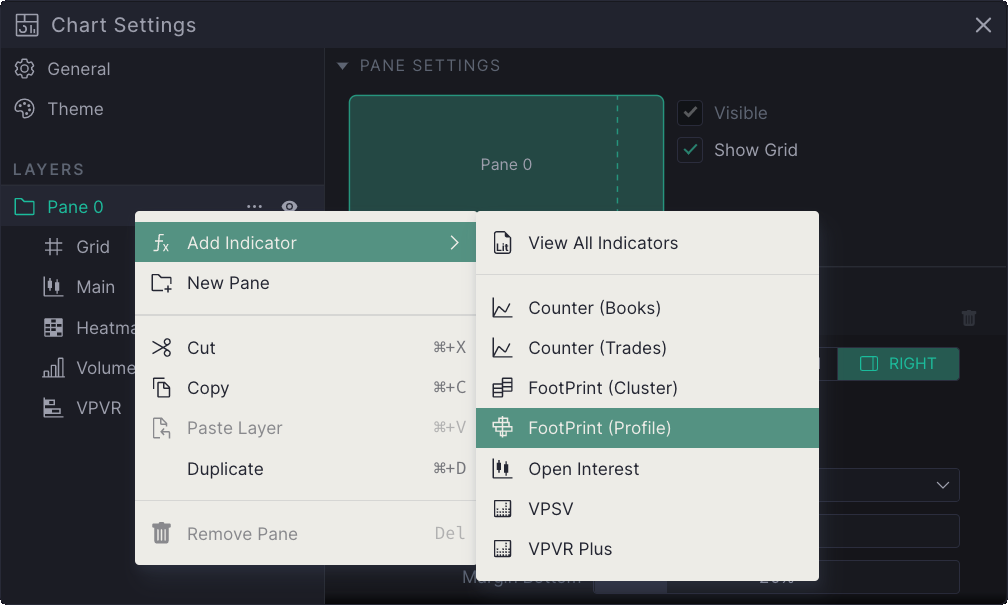
From copying and pasting elements, or quickly adding TradingLite's Official Indicators, right clicking can help you quickly navigate and select different UI options.
Theme Customization
To change the your theme, navigate to Chart Settings, and then select Theme on the left of the window.
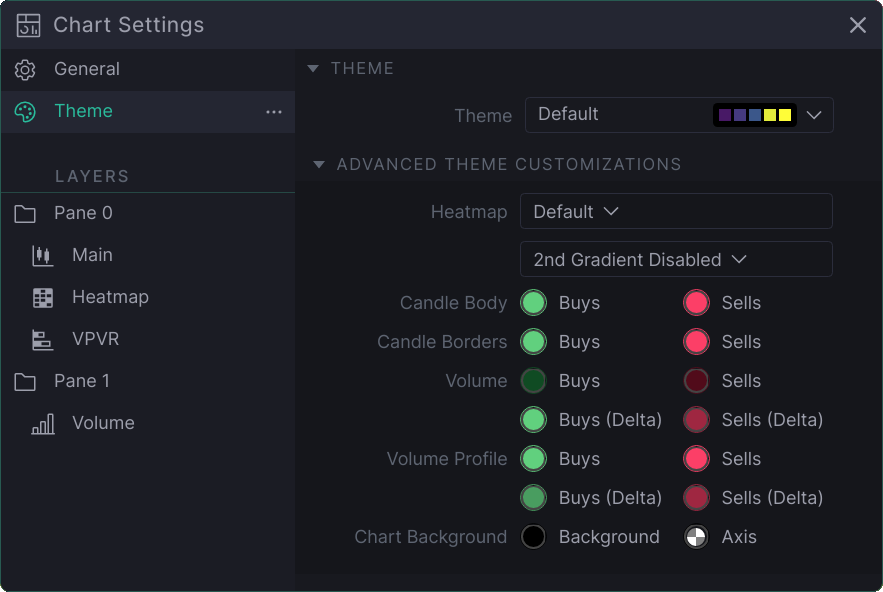
Here, you are also able to fine-tune the color and transparency of each of respective elements of the chart shown, by using the color-picker.
Heatmap Customisation
Choose from a range of 18 different themes to alter the visual appearance of TradingLite in addition to Heatmap.
The Heatmap is one of TradingLite’s core features. Details of all aspects of the Heatmap, to maximise its utility to your trading methodology, is available in both the Heatmap Basics and Heatmap Advanced guides.
Command Palette
Although TradingLite has a large number of keyboard shortcuts (press K when viewing the chart fo a full list), an alternative to this is the Command Palette.
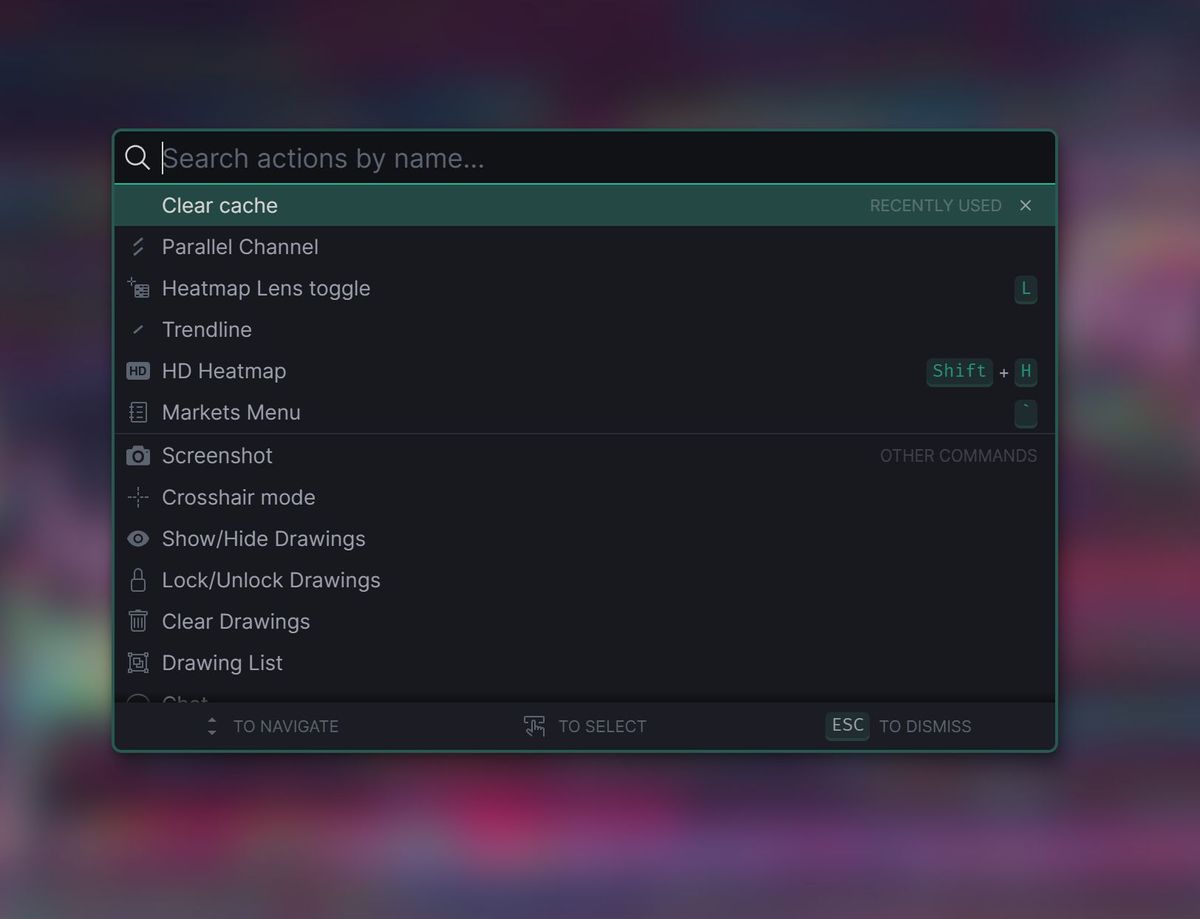
Here you can simply type the action you wish to perform and hit enter. We will be adding different commands in the future. If there is a command in particular you would like to see added, please leave a suggestion.
Was this page helpful?