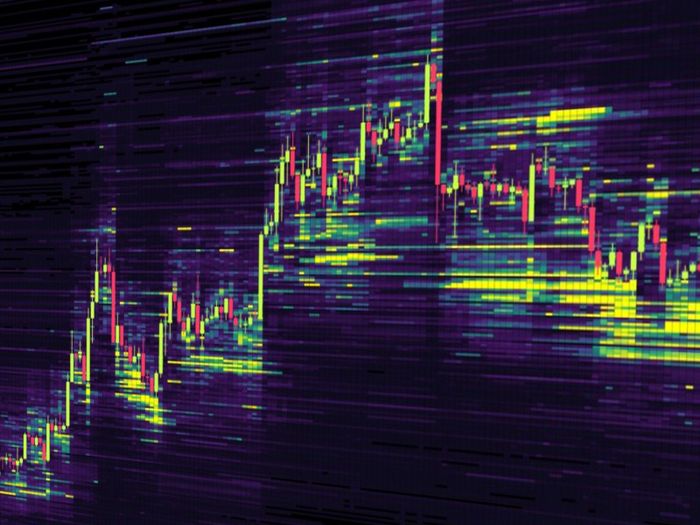
The heatmap is one of the primary tools on TradingLite. In this introductory guide, we will walk through the key components that form the heatmap, in addition to basic heatmap tool settings.

Heatmap Overview
The TradingLite heatmap is a graphically represents liquidity conditions within the order book.
Over time within the Order Book, limit buy and limit sell orders are either; placed, modified, cancelled or filled. Each of these changes in liquidity are monitored, measured and recorded in real-time by the TradingLite Heatmap.
These historical records are paired with live order book data streams, to collectively create the visual render of the heatmap.
The TradingLite Heatmap shows the cumulative value of:
Limit sell orders (asks), above price
Limit buy orders (bids), below price
At the end of each candle's life, a snapshot of the order book is captured. These liquidity snapshots collectively form the heatmap.
Updated in real-time, the TradingLite heatmap also shows the current live liquidity conditions of the respective market. Observing the heatmap above and below the current candle, you will see the heatmap changing rapidly as limit sell and limit buy orders are placed, modified, cancelled or filled within the Order Book.
Heatmap Blocks
TradingLite's Heatmap consists of a grid of blocks, each with a specific color / intensity that represent the cumulative strength of supply (limit sell orders) or demand (limit buy orders), at each price grouping, for each candle.
![tutorial1[1].png](https://s3.tradinglite.com/uploads/cms/tutorial1_1_23b135b6c0.png)
The brighter the heatmap block, the larger the cumulative value of orders that were recorded at that given price grouping, at that particular time.
Heatmap blocks above & below the current live candle may change color or disappear.
If a block changes color, the value of orders at that price is changing.
If increasing in brightness, the cumulative value of orders is increasing.
If decreasing in brightness, the cumulative value of orders is decreasing.
If a block disappears, the value of orders at that price is now zero.
Heatmap Intensity Slider
TradingLite offers you the ability to finely-tune and precisely configure exactly how the heatmap's data is both filtered and rendered.
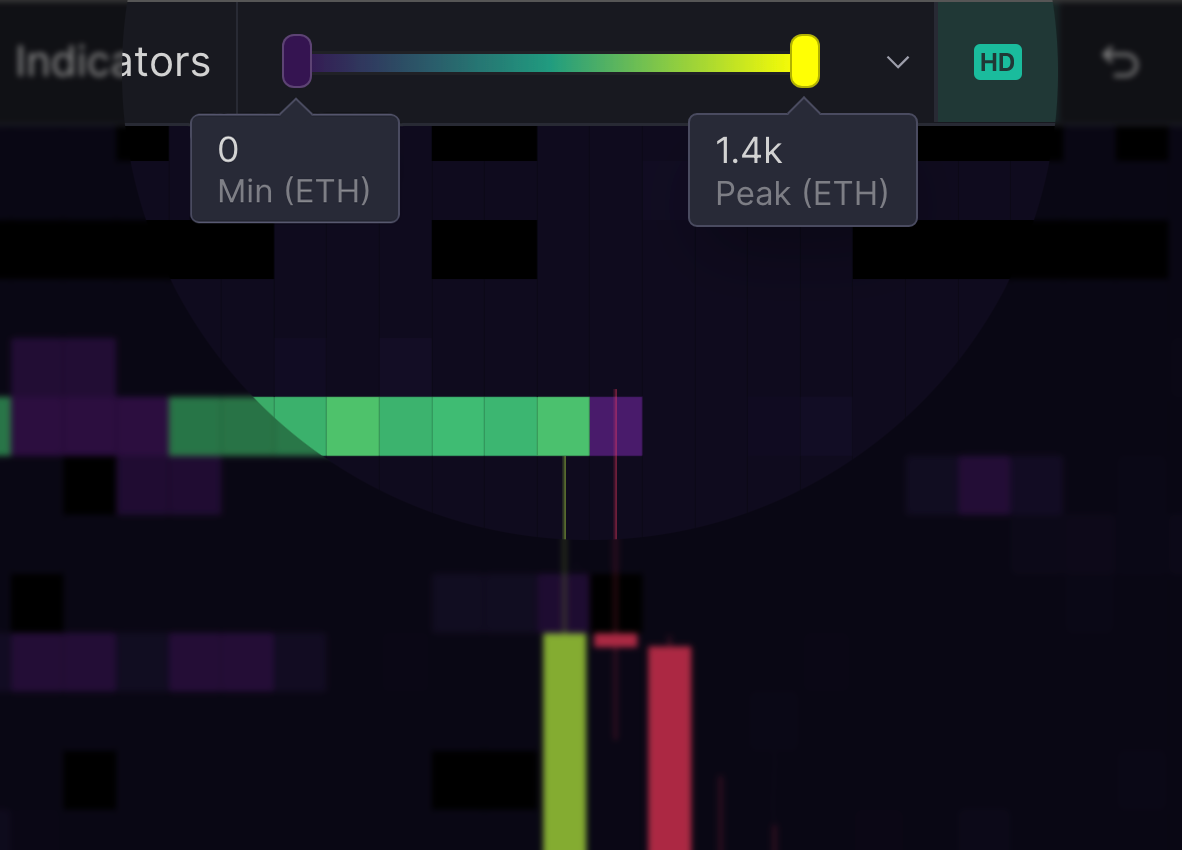
This is primarily achieved by using the Heatmap Intensity Sliders within the top toolbar. The slider’s colors serve as a legend, for the values within the heatmap itself.

The 'Low' slider on the left determines the lowest cumulative value of orders to be displayed within the Heatmap. If the value of orders recorded are less than the value entered within the 'Low' input, they will be filtered and subsequently excluded from the heatmap. | The 'Peak' slider on the right determines the value of the heatmap's peak color intensity. The larger the value entered, the wider the color range in which all heatmap data can fall within. Any values greater than this peak input will all share the same peak color/intensity. |
HD/SD Heatmap Block Size
Each heatmap block represents the cumulative value of orders at each price grouping.
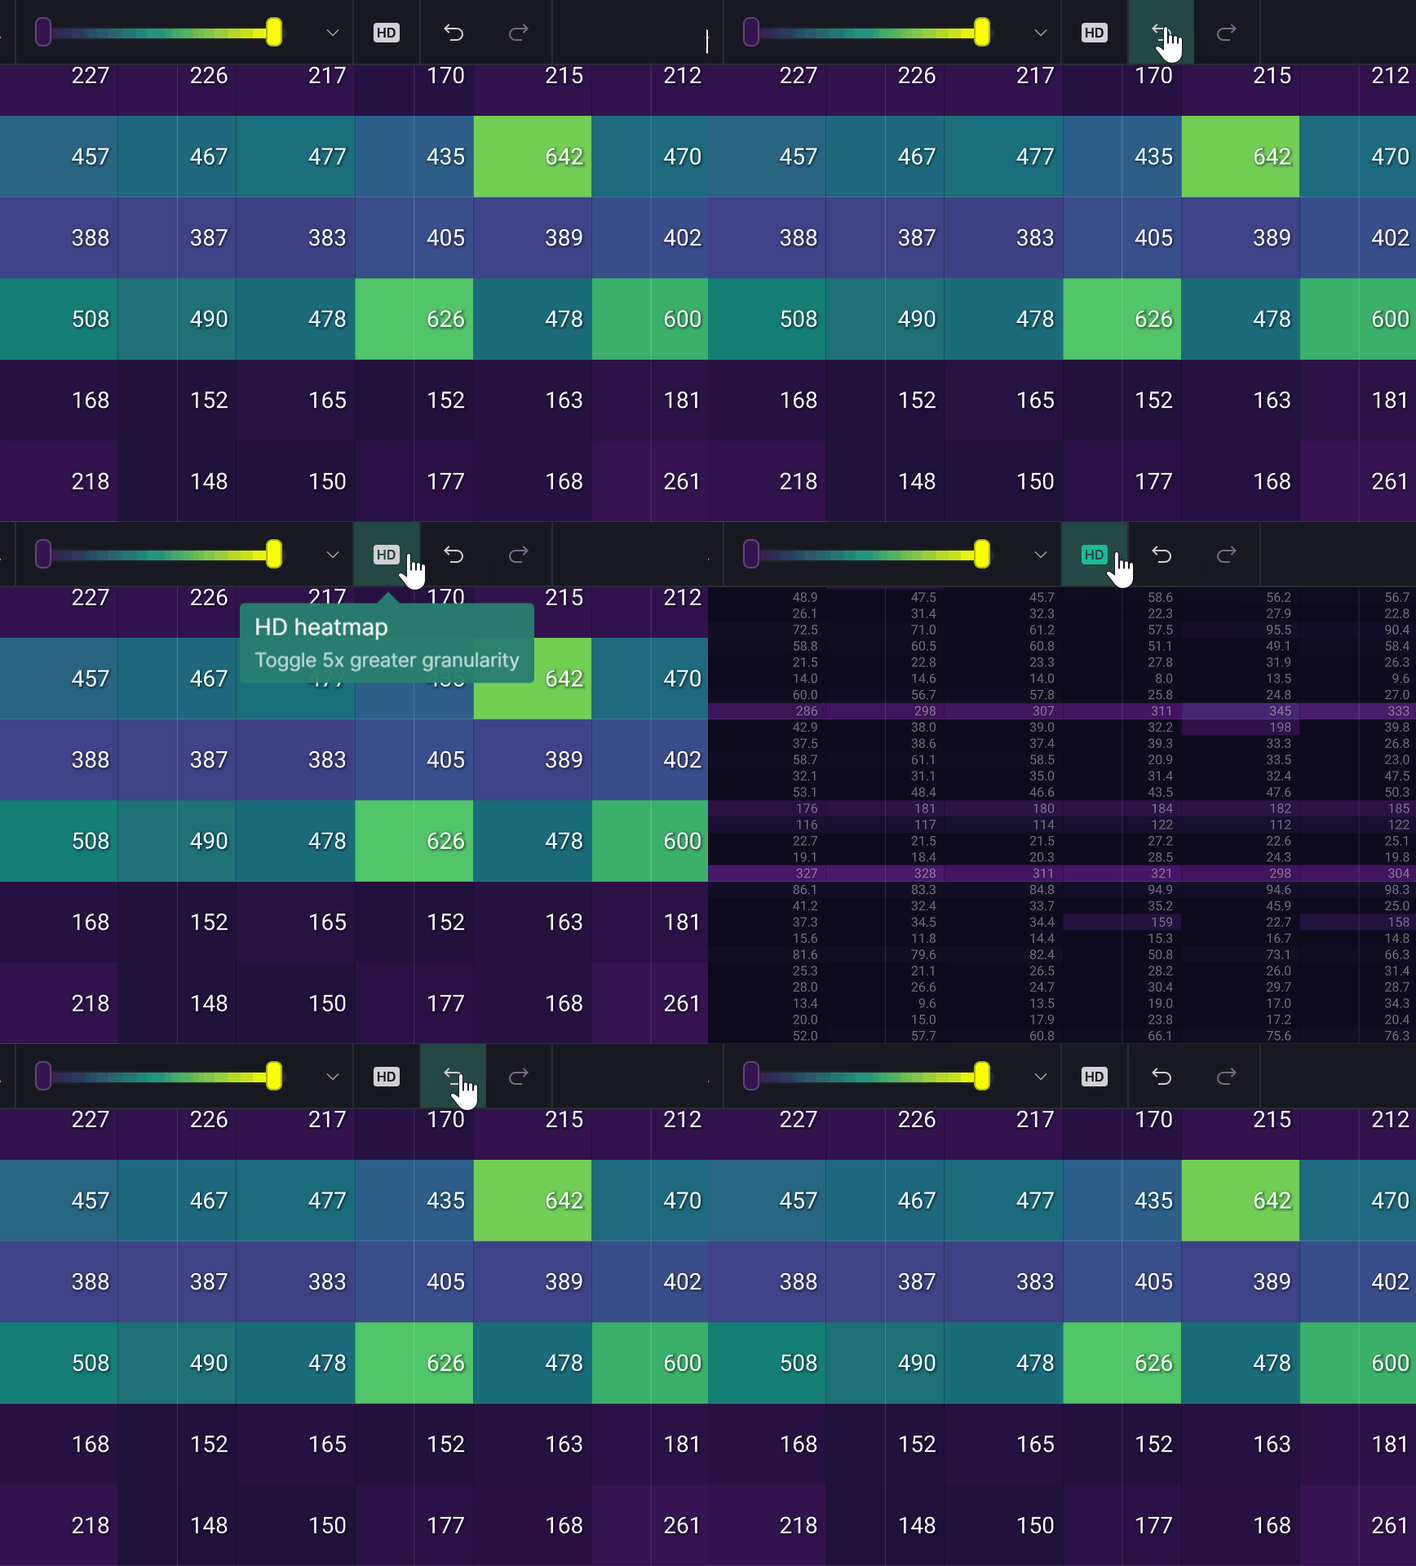
The TradingLite Heatmap has two block sizes to choose from: HD and SD

The primary benefit of a lower block size/incremental value (HD), is that the Heatmap will provide a substantial 5x greater accuracy than the standard, (SD) option.
This is particularly useful for those wishing to view liquidity data with the highest possible detail and precision.
HD heatmap option is only available to Gold subscribers.
Upgrade your plan to gain access to 5x greater heatmap detail & accuracy.
Heatmap Themes
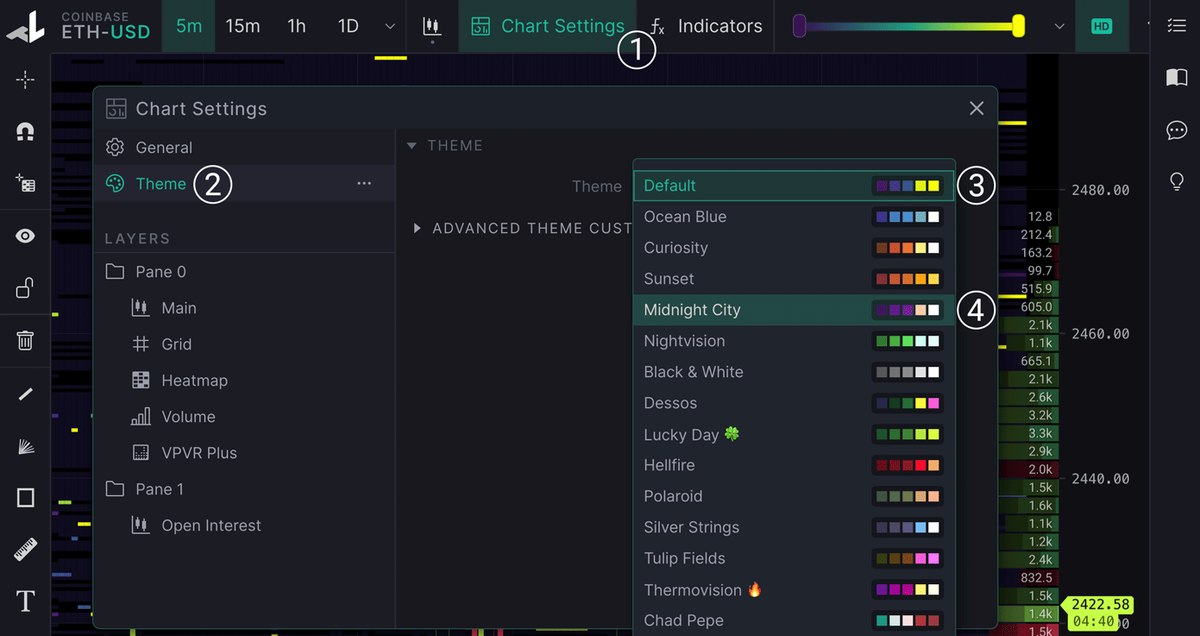
You can change the Default Theme by navigating to: Chart > Theme

Note that changing the main theme (as shown below) will result in aesthetic changes to both the heatmap and other chart elements.
If you are seeking to only change the heatmap theme itself, see the section within the 'Theme' settings labelled, 'Heatmap Colors'.
The heatmap themes aren’t just for purely for aesthetic purposes only. Some (particularly those that utilize one or two primary colors), are finely-tuned to visually indicate subtle differences within the heatmap data and render itself.
Extend Heatmap
The Heatmap can be extended to help visualise real-time liquidity conditions, with greater clarity. This view can be particularly helpful when zoomed out.
To extend the Heatmap: Indicators > Official Indicators > Heatmap > Extend Heatmap
Here you will be able to select how far you wish to extend the render, beyond the current candle.
Alternative: Order Book Profile
As an alternative the the extended heatmap view, those preferring to view live order book liquidity as a profile can do so via the Order Book Profile tool. Rather than presenting the data in color graded uniform blocks, this tool plots a profile for each side of the book, directly on your chart.
Heatmap Advanced Guide
Whilst this guide has covered the fundamental basics of the TradingLite heatmap, those seeking to maximize their utility of the tool also consider reading the Heatmap Advanced guide. The core principles and tools introduced here, are expanded upon within the advanced guide.
Was this page helpful?