Footprint Basics
This Footprint Basics guide is more to give you a brief overview and quick-start designed to get you familiar with Footprints on TradingLite.
There is a Footprint Advanced guide that begins to apply some basic footprint trading strategy, plus dedicated Footprint Profile and Footprint Cluster articles that explains each layer, including their enhanced 'Plus' versions in greater detail.
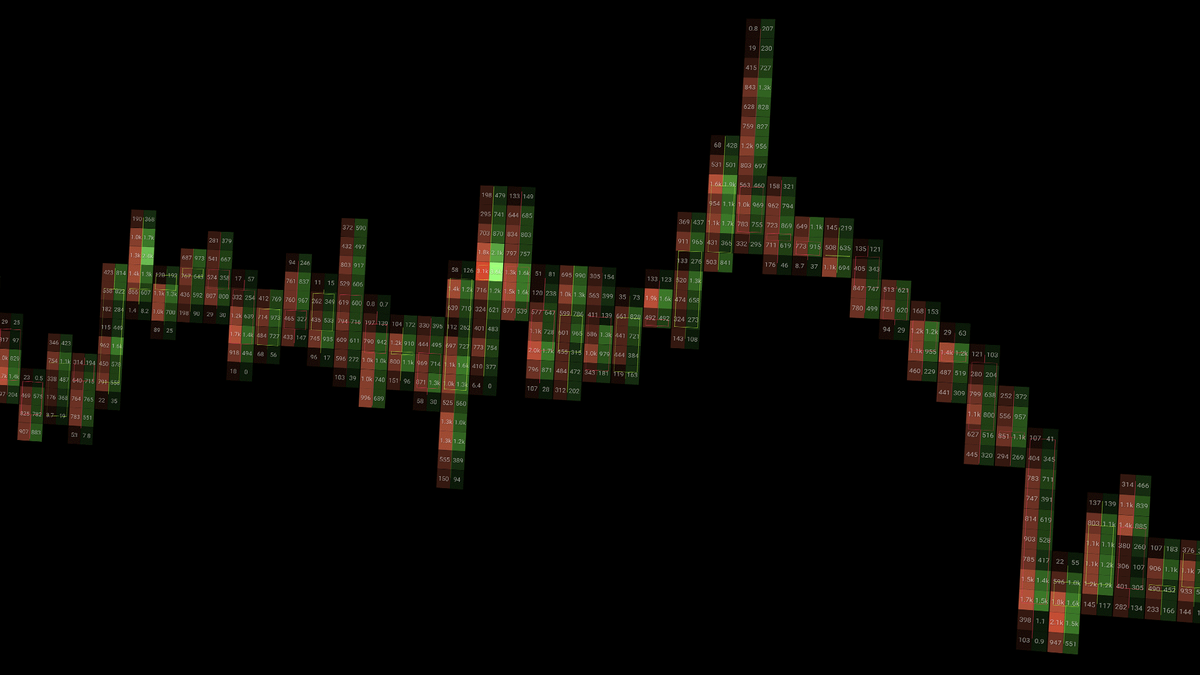
TradingLite's Footprint charts allow you to view real-time order-flow in rows within each candle, by displaying market sells and market buys, at grouped price points.
There are 4 available Footprints styles within TradingLite:
Footprint Profile and Footprint Cluster are available to all paid users.
Footprint Profile Plus and Footprint Cluster Plus - which provide enhanced features such as naked point of control, value areas and stacked imbalances - are only available to Gold subscribers.
Enabling Footprint Charts/Layers
There are two methods to add Footprints within your TradingLite chart:
Footprints as a Chart Type
You can add any of the Footprint layers via the chart type selection, within the top toolbar.
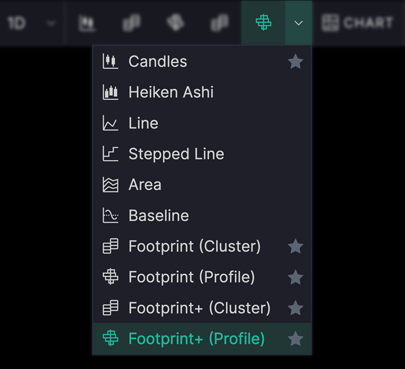 | Selecting Footprint as a 'Chart Type', creates a composite layer. This will combine footprints and candlesticks together, within one singular layer. |
Footprints as an Indicator Layer
The alternative to adding Footprints as a chart type, is to add the desired Footprint as a layer.
This can be achieved by navigating to: Indicators > Official Indicators > Footprint
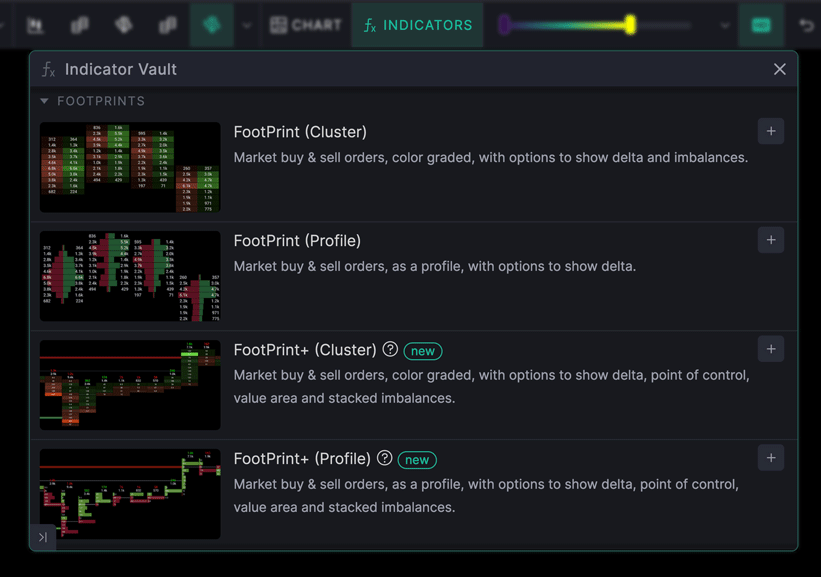
If you choose to add Footprints as an indicator layer, it will be independent of your other layers. Therefore, you will have to include a chart type in order to view Open, High, Low, Close price data.
Footprint Cluster vs Footprint Profile
Choosing between Footprint Cluster and Footprint Profile is purely a personal decision of your preferred method of visuals.
Whichever your preferred visual choice of footprints, the underlying data values of both the market sells and market buys, will always remain the same.
The more advanced Footprint Cluster Plus and Footprint Profile Plus gives you access to point of control, value area and stacked imbalances. This builds upon their non-plus variants, enhancing the data you have access to. 🚀
Footprint Cluster
TradingLite also provides Footprint Cluster which will display the same order-flow data of market sells and market buys, as color graded columns.
The brighter the color of the row within the Footprint Cluster, the greater the value of market orders, at that price point.
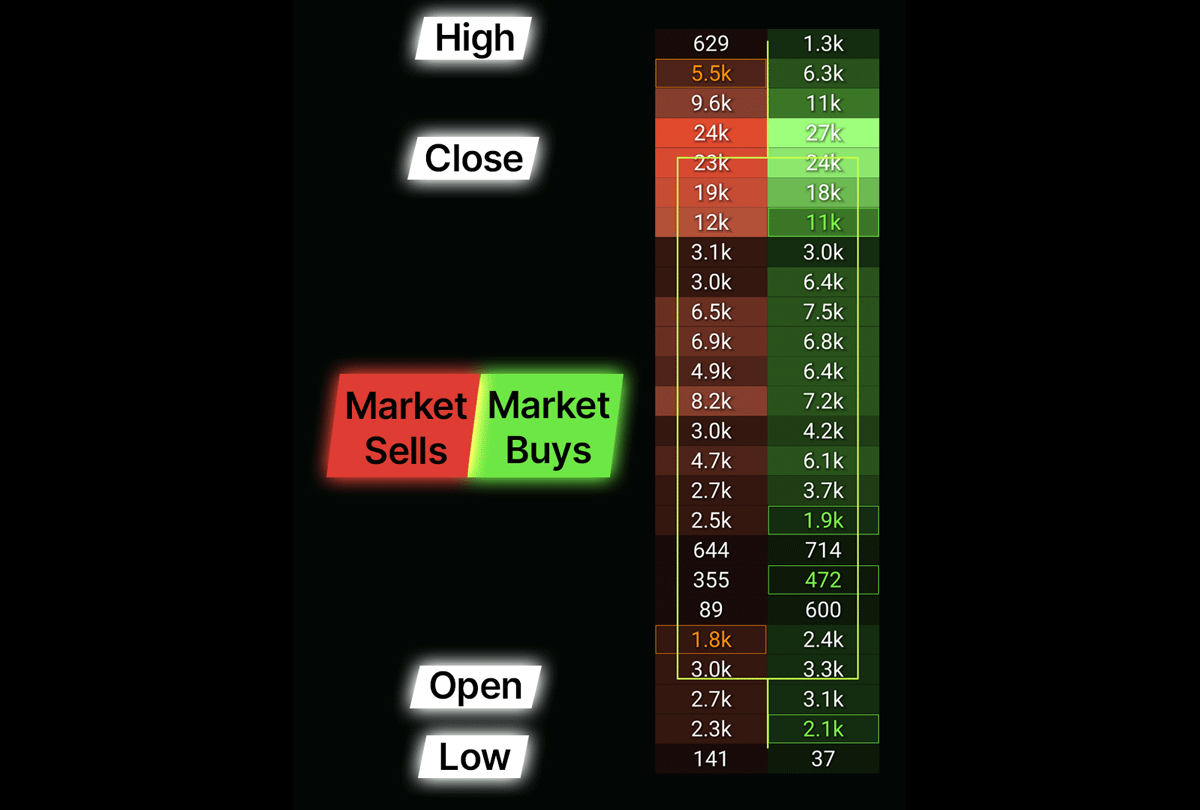
In addition to the candle's Open, High, Low & Close;
The left within each Footprint Cluster candle is the market sells, at each price point.
The right within each Footprint Cluster candle is the market buys, at each price point.
Footprint Profile
Footprint profile data is displayed within a standard candlestick.
The wider the row within the Footprint Profile, the greater the total value of market orders are, at that price point.
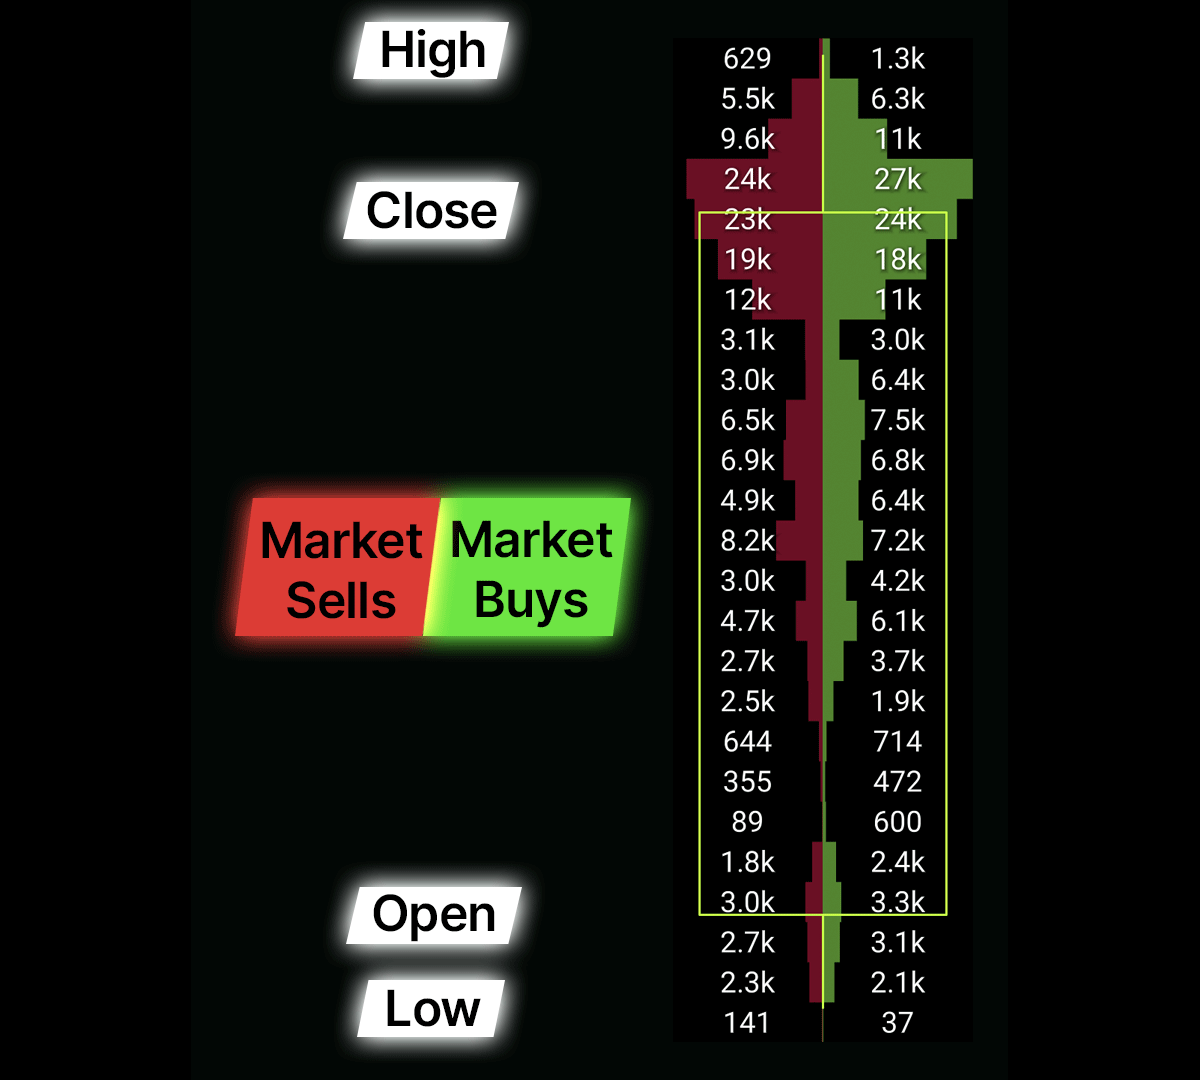
In addition to the candle's Open, High, Low & Close;
The left of each Footprint Profile candle is the market sells, at each price point.
The right of each Footprint Profile candle is the market buys, at each price point.
Footprint Settings
For both Footprint Profile and Footprint Cluster, there are configurable options available to suit your requirements:
Show Delta
Selecting this option will provide the Delta for each row, which will determine whether the market sells or market buys were more dominant, and by how much in value.
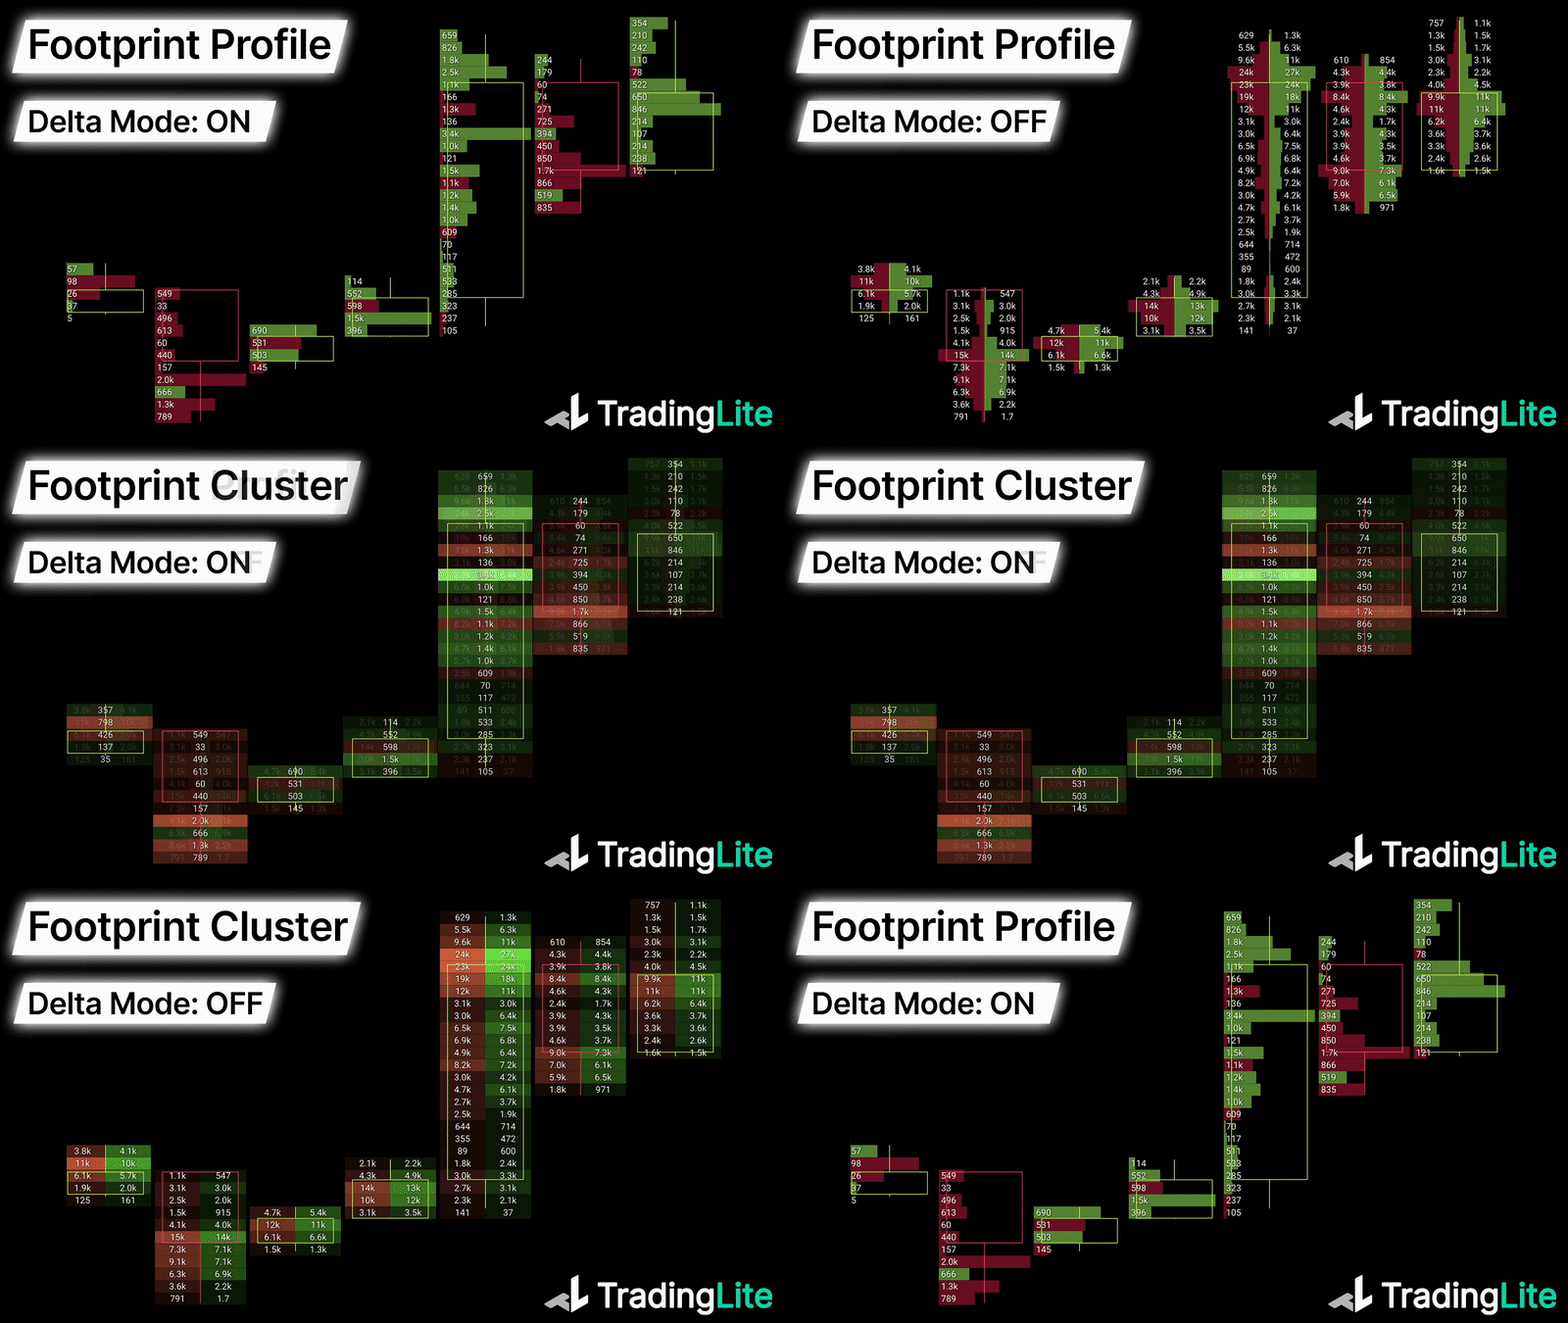
Ticks per Row
This value defines the number of price points that are grouped together to form each row within the Footprint. A higher tick per row value will group more rows, whereas a lower tick per row value will provide a more granular view of rows.
Color Grading (Cluster) / Row Width Calculation (Profile)
This setting will determine how either, the color grading of the Footprint Cluster, or the width of the rows within the Footprint Profile, are calculated.
Proportional - Default
'Proportional' will average all the candles within the daily session, and either color grading applied to rows (if using cluster), or the width of rows (if using profile), determined by comparing all of the candle's rows within view.
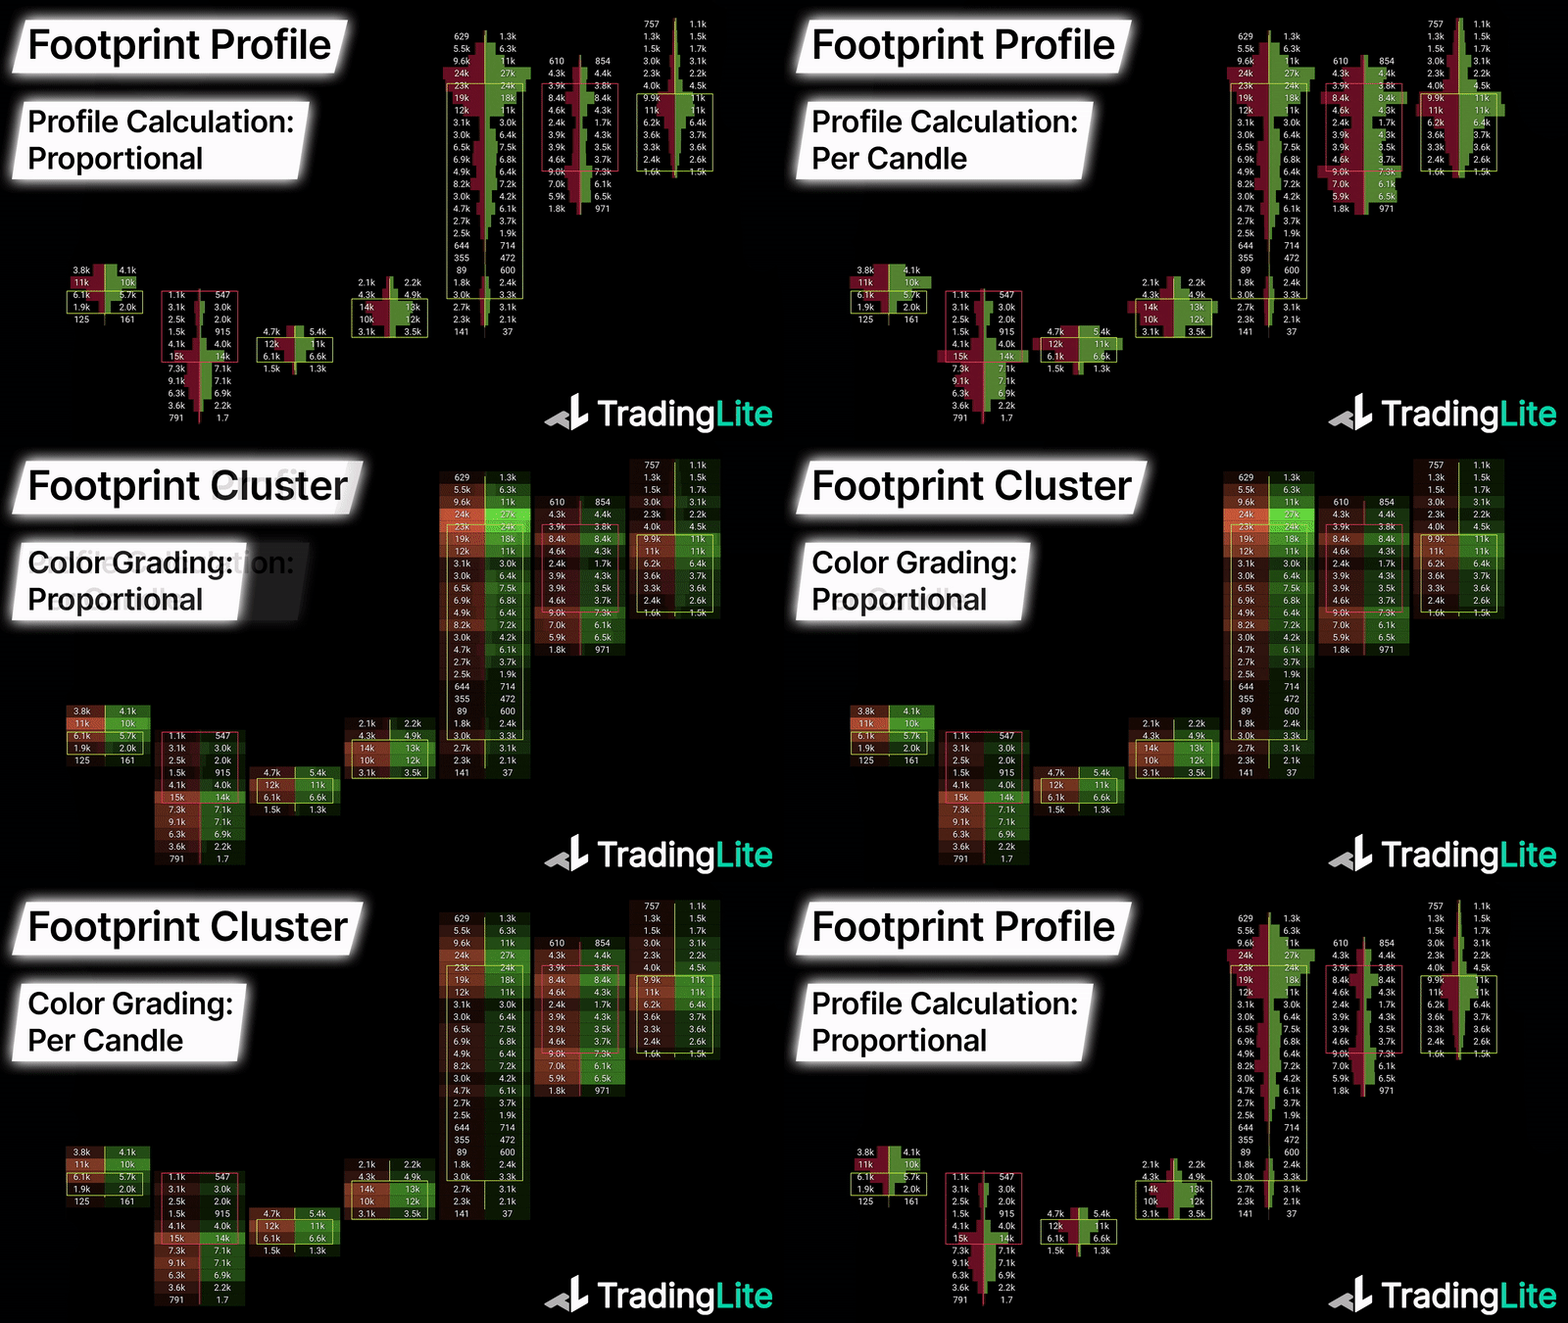
Per Candle
'Per Candle' will treat each candle uniquely, with color grading (if using cluster), or the width of each row (if using profile), determined by comparing just the rows within each individual candle.
Minimum Interval
By default, each candle will show the market sells and market buys.
Selecting a 'minimum interval' will merge candles together into pre-configured time-frames, to form wider overview.
Footprint 'Plus' Layers 🚀
The Footprint Cluster Plus, and Footprint Profile Plus, both provide the same settings as their standard counterparts, along with a variety of advanced customizations:
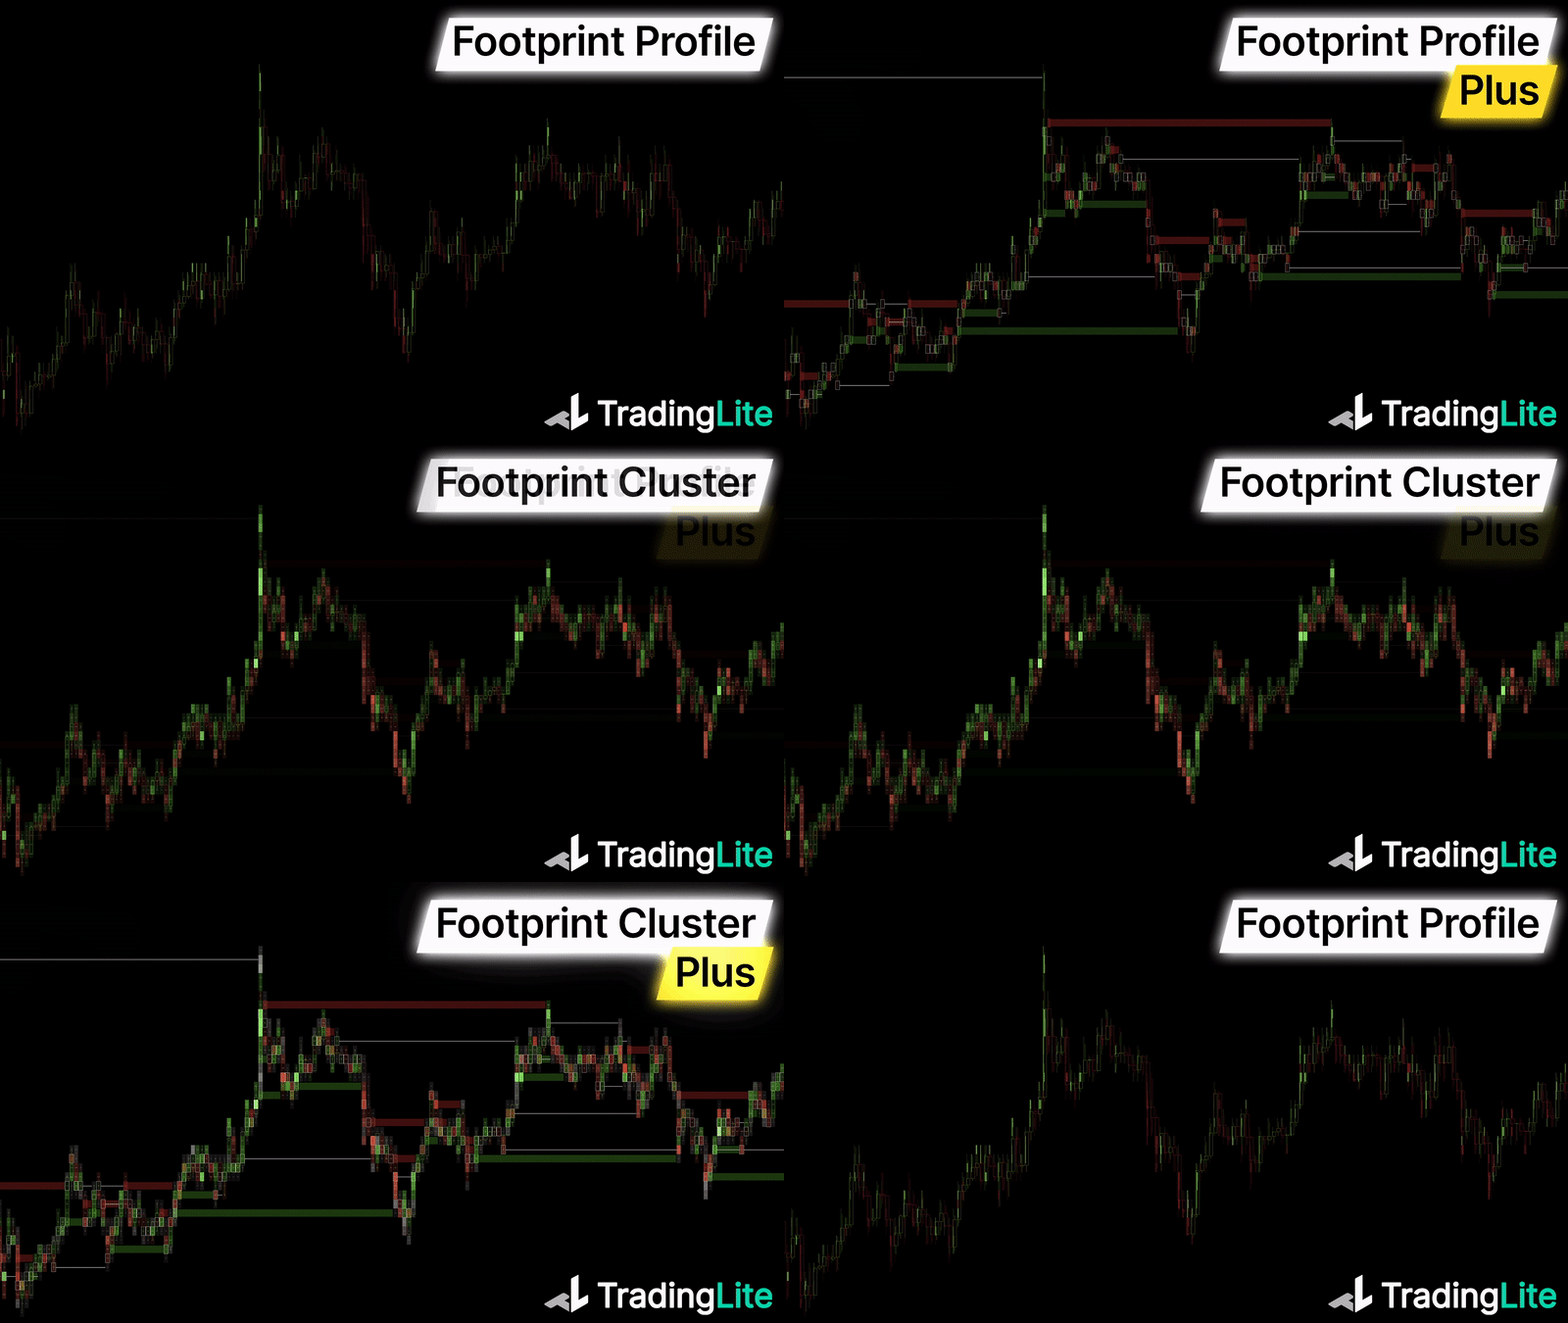
Footprint Point of Control (including Naked Point of Control)
Footprint Value Area
Footprint Naked Stacked Imbalances
Minimum Volume Thresholds
Fully customizable color scheme
As a core feature of TradingLite, we also recommend you take a moment to view at our in-depth Footprints Advanced guide.
Was this page helpful?