Footprint Advanced
This Footprint Advanced article builds upon the Footprint Basics, to provide an in-depth guide to ensure that you are fully utilizing the range of features and customizations available through the 4 TradingLite Footprint styles.
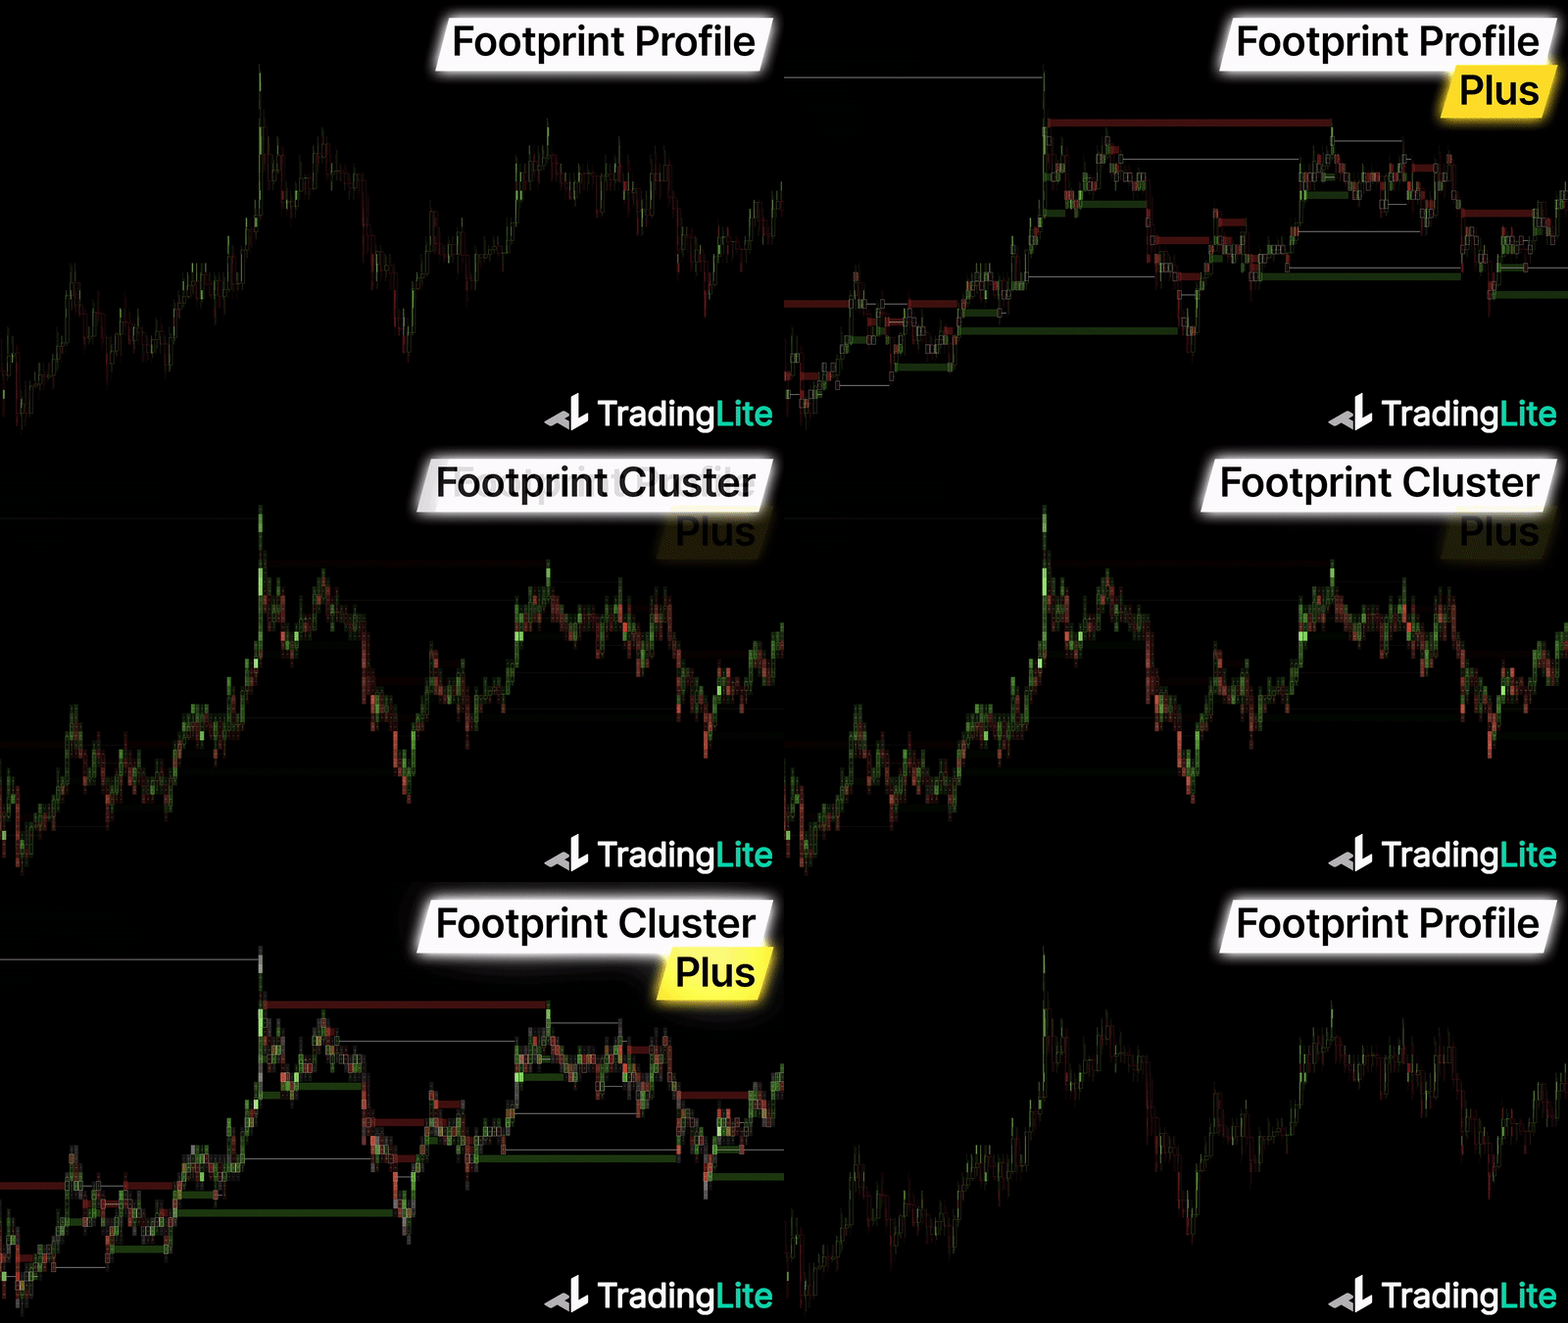
If you have not read the Footprint Basics guide, it is highly advised to begin there, to gain a good foundation first, which will enhance the context given here. Platform basics such as how to enable footprint charts are explained there.
Delta Mode
Delta Explanation
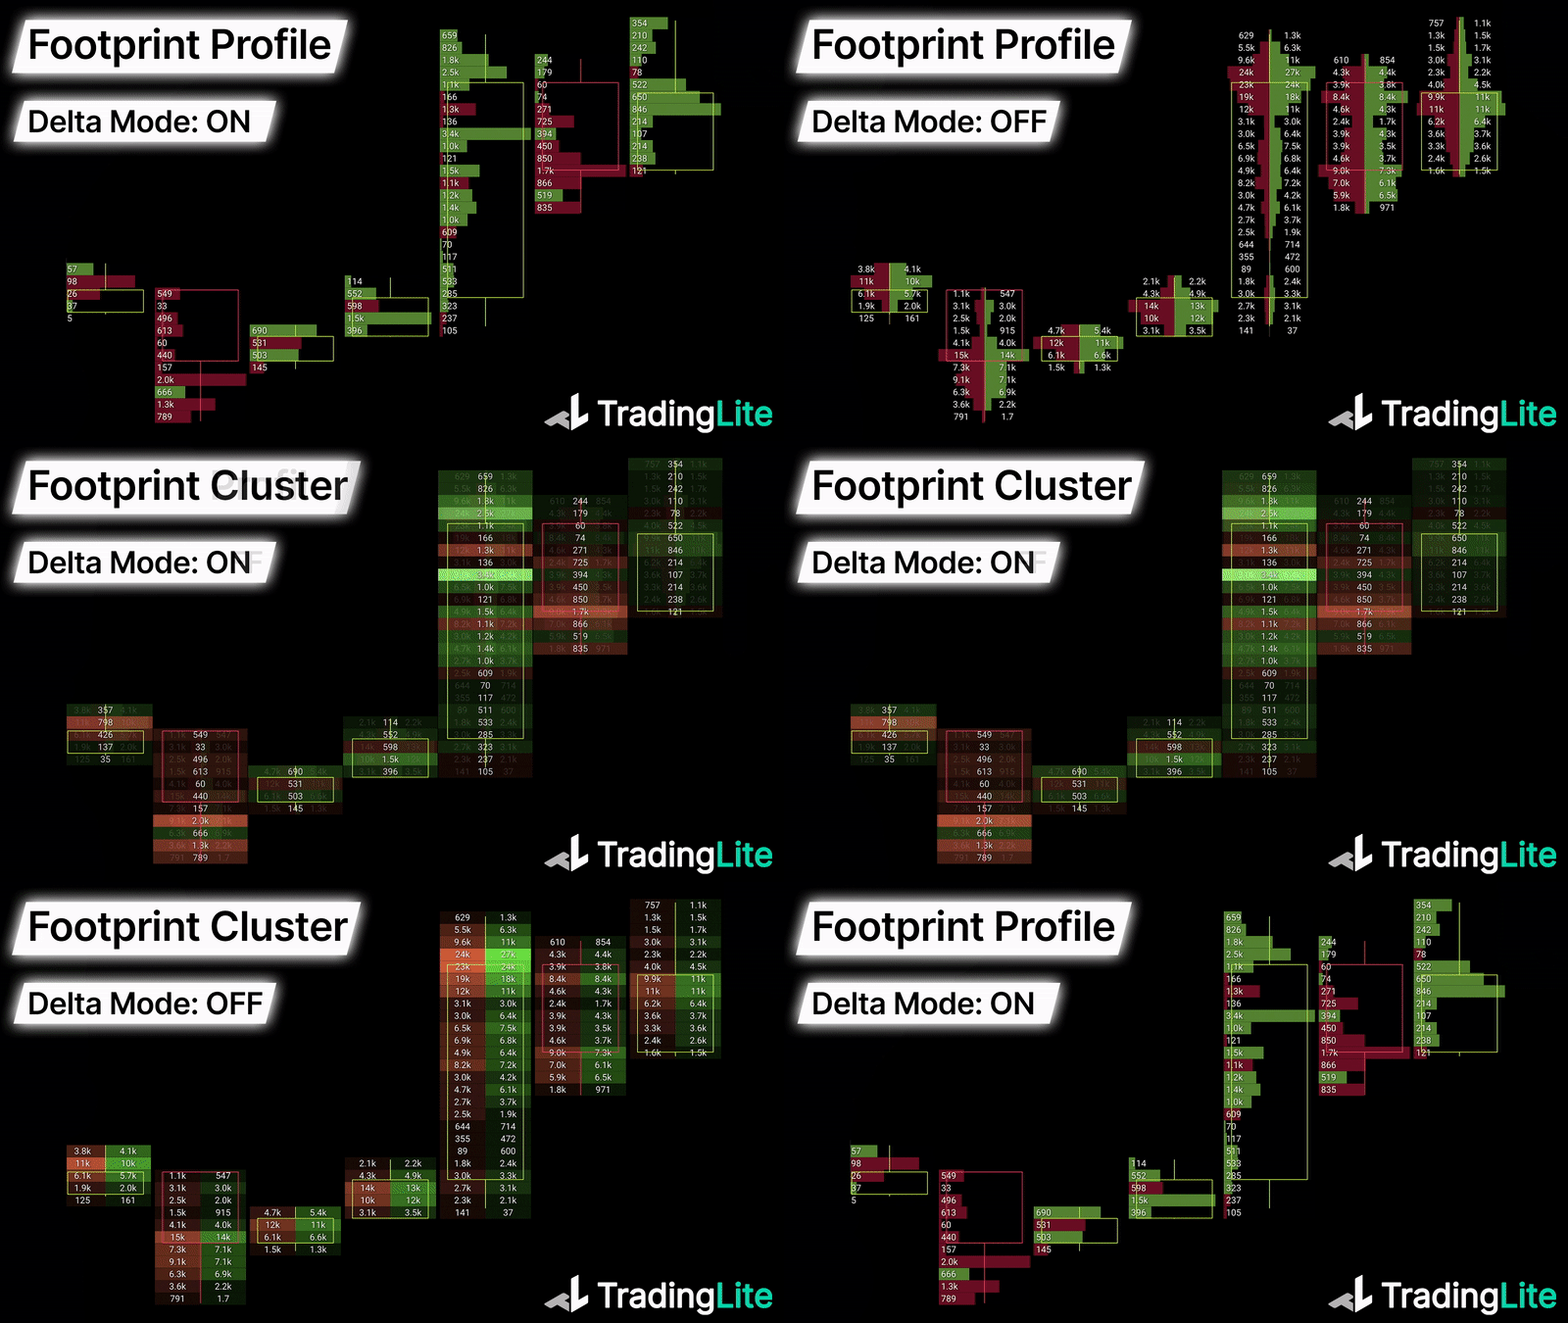
All 4 of TradingLite's Footprint styles, offer the ability to toggle 'Delta Mode'.
Rather than displaying Market Sells and Market Buys within each candlestick, the delta of the two is instead displayed.
The Delta is calculated as follows:
Market Buys - Market Sells = Delta
Delta Mode Example
'Delta Mode' can help quickly identify where either market buys or market sells were more dominant over the other. This can also help with the visualization of the order flow whilst providing an additional level on analysis.
Enabling Delta Mode
You can enable Delta Mode by navigating to:
Chart Settings > Select your active footprint layer > Toggle: Delta Mode
Footprint Imbalances
Footprint Imbalances Explanation
In order for any trade to take place, a market order has to fill a limit order. Therefore, market orders are the only way for a new price to be registered.
As TradingLite's Footprint Charts allow you the ability to view market orders, Footprint Imbalances highlight areas in which the ratio of market sells and market buys, between prices, are unusually disproportional.
Imbalances are always compared diagonally between rows of prices on a footprint chart. They are not compared horizontally across the same row.
The ratio of these abnormal imbalances of market orders between price rows, is calculated in real-time. If the ratio exceeds the imbalance value, the imbalance is highlighted.
Footprint Imbalances Example
The below example is of a footprint imbalance ratio of 250%.
This means that the imbalance of market sells and market buys between prices is 2.5x.
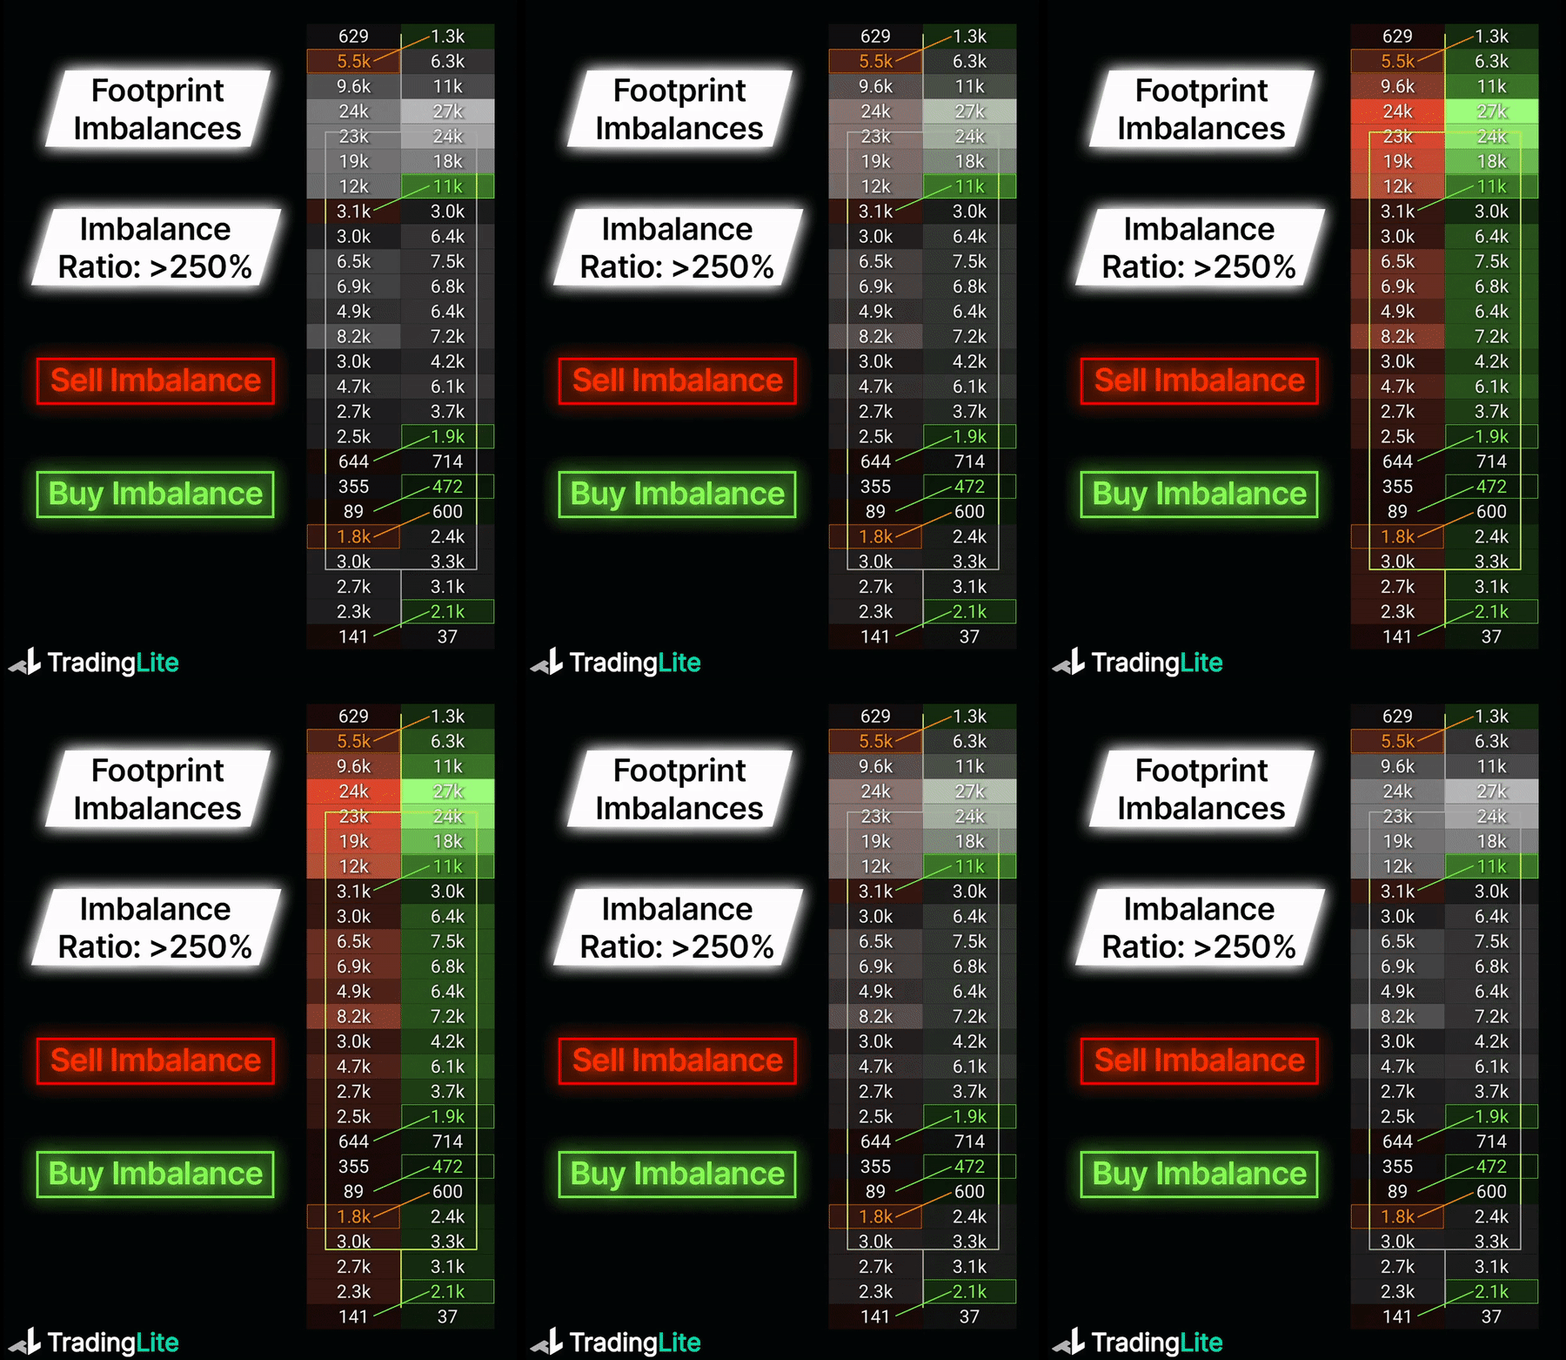
The default, and minimum Imbalance ratio value on TradingLite is 250%.
The maximum imbalance ratio that can be configured on TradingLite is 1,000%.
Stacked Imbalances
Given that imbalances a notable sign of inefficiency within the market, having these areas highlighted can often add to other confluences as a potential sign of reversal.
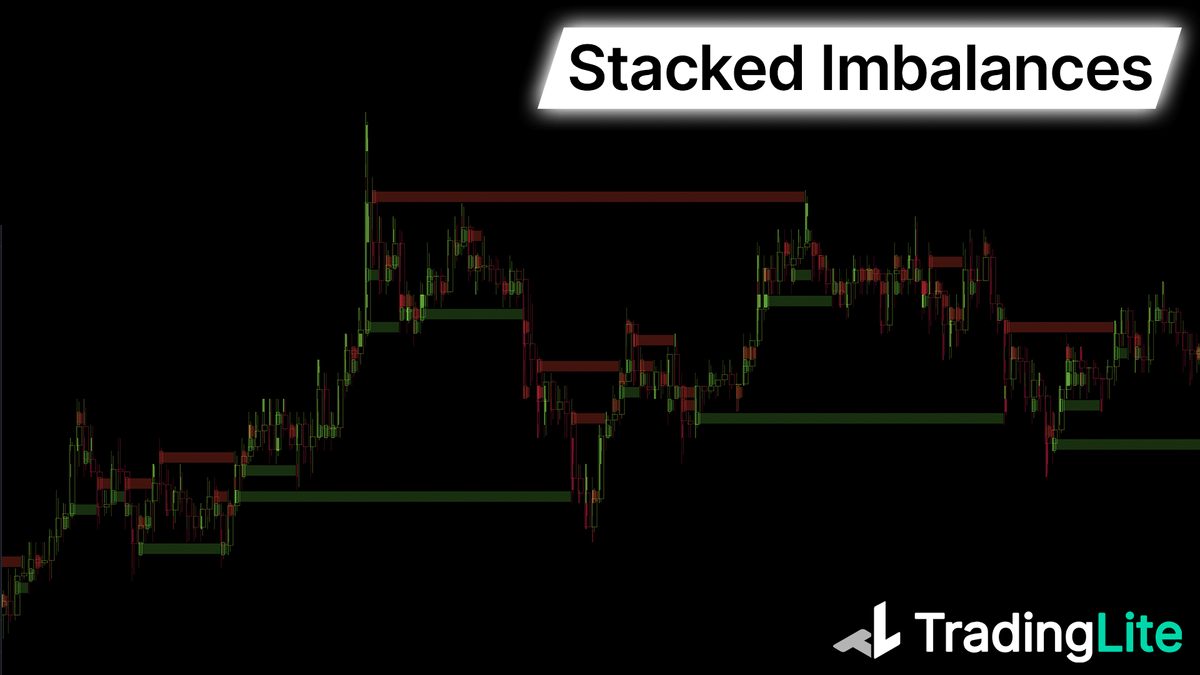
When enabled, a continuous ray will be drawn from the point of imbalance, until price re-visits to test the previous point of inefficiency.
Stacked Imbalances are only available within the Footprint Cluster Plus or Footprint Profile Plus layers. These layers are only available to Gold subscribers.
Enabling Footprint Imbalances
Enabling Imbalances is slightly different depending upon the Footprint layer:
Footprint Cluster:
Chart Settings > Select Footprint Cluster > Mode: Imbalances
Footprint Cluster Plus & Footprint Profile Plus
Chart Settings > Select Footprint Cluster/Profile Plus > Imbalances Toggle: Enable
Configuring the Imbalance Ratio
Once you have enabled the imbalance mode, you will then be able to choose and select from a list of imbalance ratio values.
Point of Control
As a reminder, the Point of Control (or POC) is the row in which the most volume occurs. Whilst it more synonymous with VPVR, VPVR + and VPSV, the same logic can be applied within each candle of a footprint chart.
Footprint Point of Control is only available within the Footprint Cluster Plus or Footprint Profile Plus layers. These layers are only available to Gold subscribers.
Footprint Naked Point of Control
To make these Point of Controls even easier to identify in relation to future price action, you can choose a naked extension option within your TradingLite footprint layer.
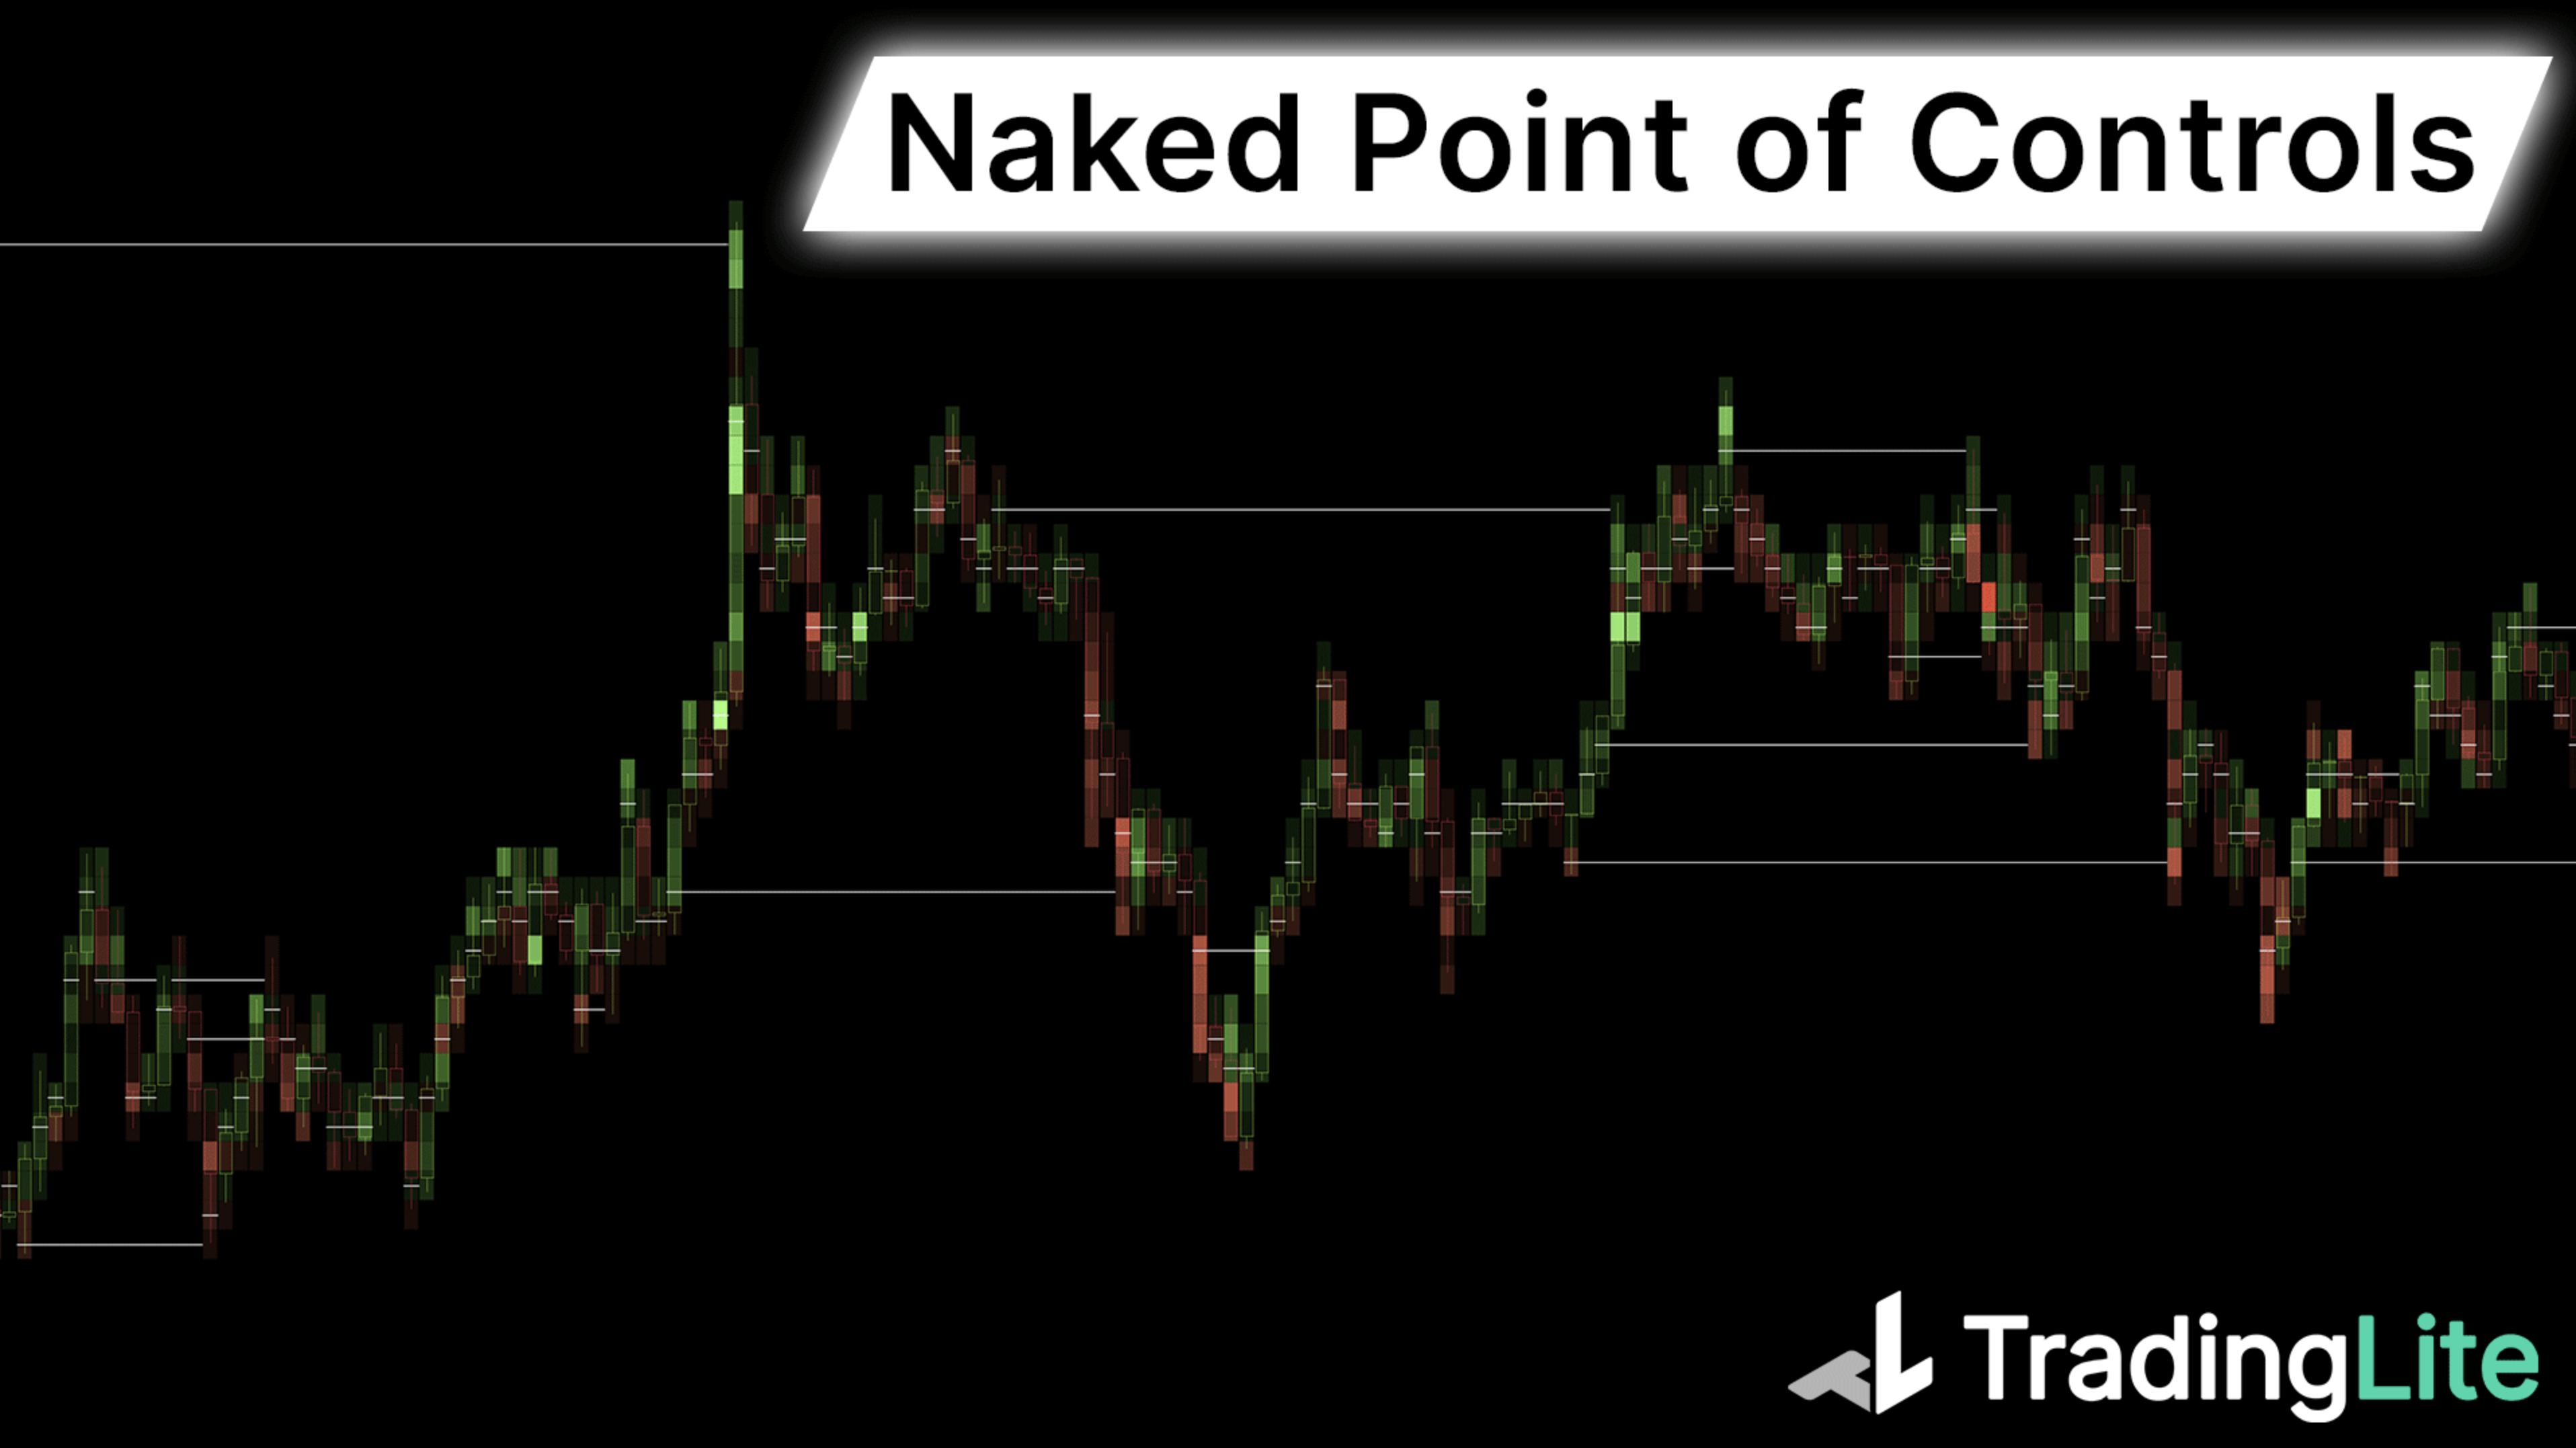
If enabled, the POC will extend indefinitely, until price re-visits to test the previously identified high volume node.
Enabling Footprint Point of Control
You can enable the Footprint Point of Control via:
Chart Settings > Select Footprint Cluster > Point of Control > POC: Enable
Value Area
Similar to the other Volume Profile Tools available within TradingLite, the Value Area (defined as the range in which the majority 68/70% of volume was traded) can also be enabled with TradingLite's footprint charts.
If a row within the footprint is colored, it is within the Value Area. Rows that are colorless, fall outside of the Value Area.
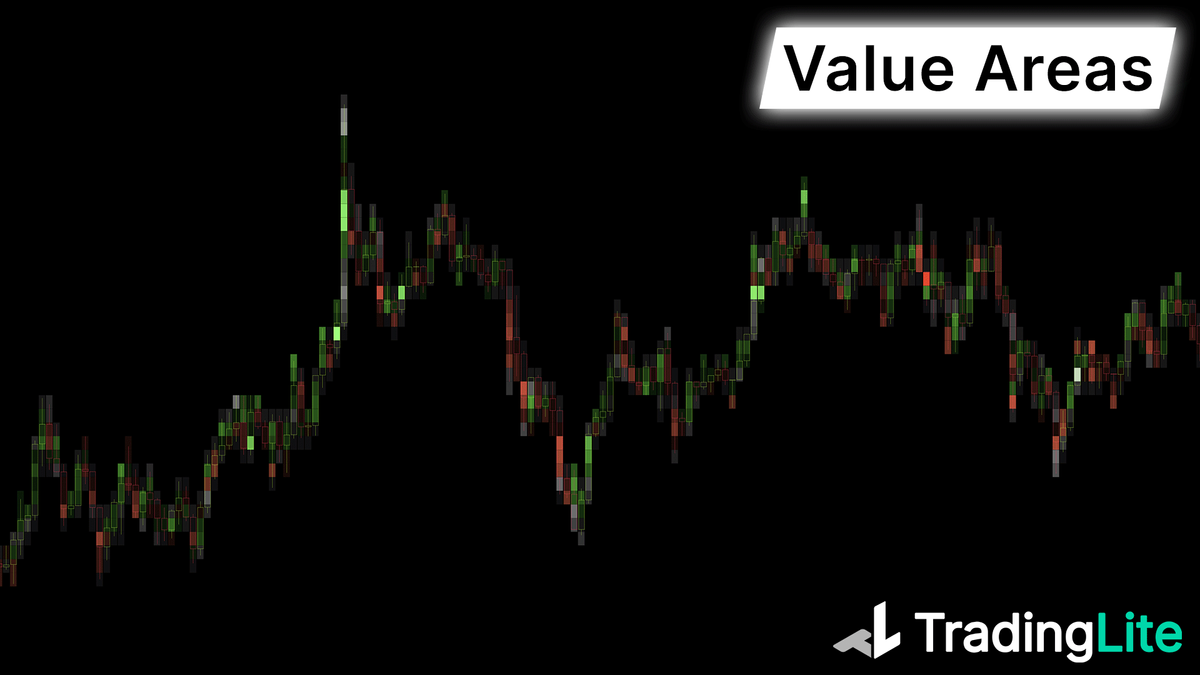
Footprint Value Area is only available within the Footprint Cluster Plus or Footprint Profile Plus layers. These layers are only available to Gold subscribers.
Enabling Footprint Value Area
You can enable the Footprint Value Areas via:
Chart Settings > Select Footprint Cluster > Value Areas > Enable
Enabling the Value Area will highlight the area in which the majority of the volume took place. The areas outside the Value Area will be color-less. This percentage value is configurable to suite your desired range. The brightness in comparison to the rows that fall outside the Value Area can also be configured.
Minimum Volume Highlight
Enabling this will highlight each row of the footprint cluster, in which the total volume exceeds your given threshold.
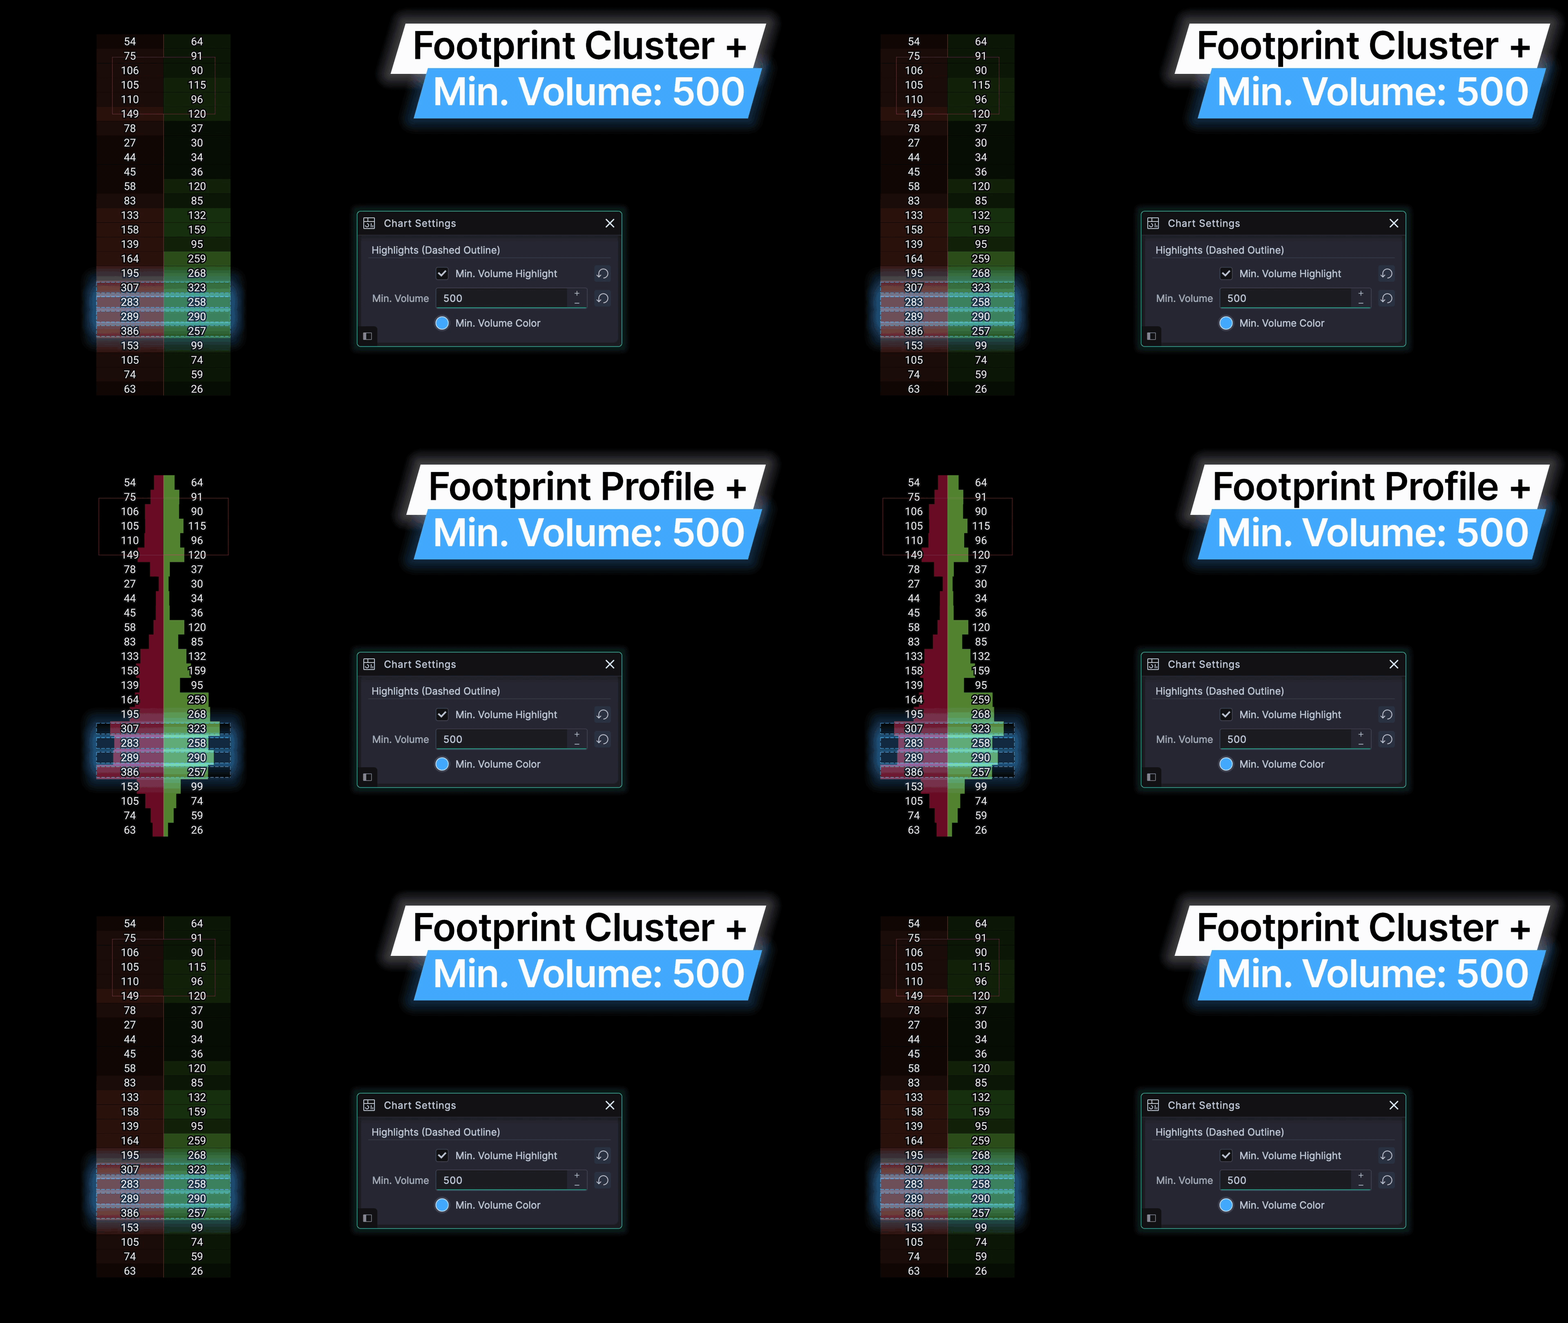
This is especially valuable when in Delta Mode, as a visual indicator of high volume, and therefore by extension, high interest by market participants at that particular price point in time.
Note: Regardless of delta value itself, if the total volume of the row exceeds your minimum volume threshold, the dashed visual highlight will be rendered.
Footprint Strategy
Whilst some of the more advanced tools and customizable options available for TradingLite's Footprint Plus layers can help easily identify points of interest, some basic order flow strategies can also help in your trading decisions.
Test of Support/Resistance
A common use-case of Footprint based order flow analysis (in combination with technical analysis), is when price either increases or decreases, past a major point of support or resistance. Sustained buying or selling pressure adds confluence to the suggestion of a newly formed ‘support’ or ‘resistance’ level.
Squeezing Traders
If one was to choose a Footprint view, the aggressiveness of market orders can be assessed. It may be possible to determine whether the move below ‘support’, or above ‘resistance’, will be a protracted move of price, or possibly, an attempt to temporarily squeeze other traders out of their positions (only to reverse the price movement soon after).
Combining with Open Interest
By combining a real-time view of TradingLite’s Footprint charts, in addition to either TradingLite's official Open Interest indicator, or one of the many community written Open Interest indicators, we may be able to deduce whether the intensity of market orders, led to an increase or decrease of open positions. This may in turn influence how long-lived the trajectory of the price movement is, or perhaps, will be.
Filling of Limit Orders
Using the real-time Footprint chart, it may be possible to determine, whether a price level highlighted by the TradingLite Heatmap will act as a barrier to price. We can make this assessment as price nears this area of interest, by comparing the value of these limit orders, with the value of market orders. If the intensity of the buying/selling pressure at particular point is strong, or if the limit orders get pulled, price is likely to continue unabated.
Ultimately, using TradingLite’s Footprint based charts, in addition to the suite of other TradingLite tools, may provide valuable insight, in an otherwise ‘noisy' trading environment.
Be sure to also consider the Footprint Bar Statistics layer. The visualizations created by the color grading, can provide additional context when conducting order flow analysis.
Looking for more order flow related content. Not to fret, we have you covered below:
Was this page helpful?