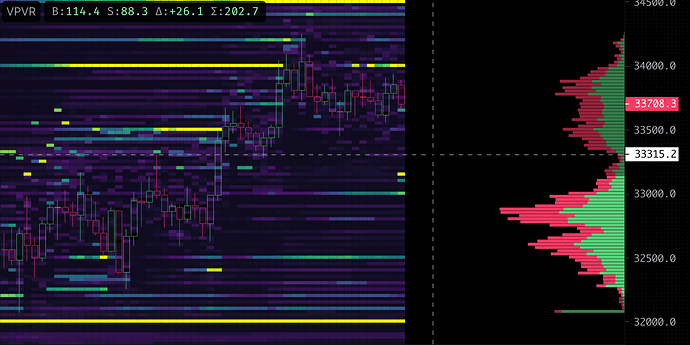
VPVR
The traditional VPVR (Volume Profile Visible Range) indicator shows the volume of market buys and market sells at various price points, of the candles currently in view.
Within this profile is the Value Area, which is shown via a brighter highlight than the remainder of the VPVR.
Value Area is where, 70% of the total volume occurred, of all candles in view. You can configure this 70% value within the VPVR options.

VPVR Settings
Align - Determines whether to display the VPVR on either the left, or right.
Width - Determines the overall width of VPVR as a percentage of your screen.
Ticks per Row - Determines how many price points are amalgamated together to form each row of the VPVR. Selecting a lower value will provide a more granular view, whilst selecting a higher value will group together a greater number of price points, reducing noise.
Show Value Area - Checkbox to toggle whether the ‘Value Area’ is distinguishable via highlight.
Show Delta - Checkbox to toggle viewing each row of the profile as a delta, to determine whether the market buy or market sell pressure had greater dominance. If you prefer this view, we recommend that you consider TradingLite’s VPVR Plus.
Point of Controls Settings
As with all of TradingLite’s Profile Indicators, you have the option to enable, extend and style the POC.
POC (or Point of Control) is an additional optional visual indicator that quickly highlights the node within the profile which had the greatest total value of buying & selling interaction.
Enable - Enables POC
Extend - Extends the POC beyond the default width
Color - Customise the color and transparency of the POC.
Show Point of Control - Checkbox to toggle whether the ‘Point of Control’ is distinguishable via a white ray.
TradingLite Official Indicators
VPVR is one of a number of TradingLite's Official Indicators
Be sure to also check out the growing list of over 400+ indicators created and shared by our community using Litscript.
community using Litscript.
Was this page helpful?