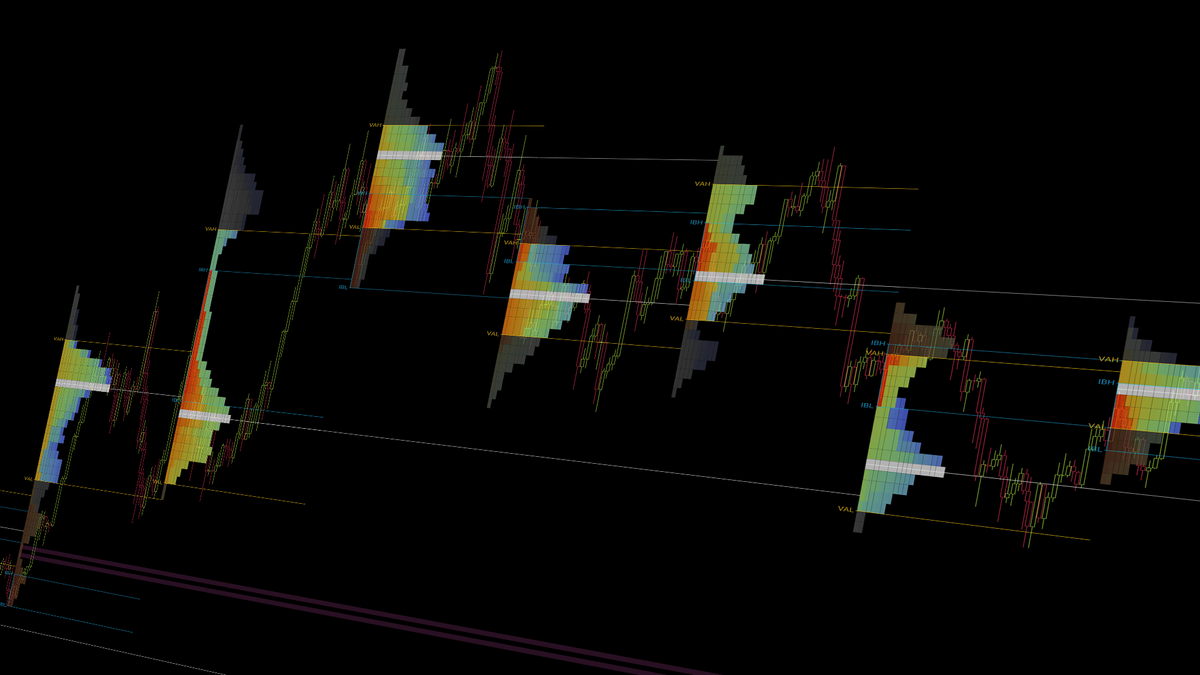
TPO & Market Profile Advanced
There are a variety of different methods to apply TPO within a trading strategy, so much so, that many have taken Steidlmayer's initial concept of Market Profiles, and have expanded upon them in a variety of books.

Without this learning page turning into a book itself, we will explore some methods of applying TPO / Market Profile to your trading.
If you are unfamiliar with TPO / Market Profile, it is highly recommended that you first start with our TPO & Market Profile Basics Guide first, then return here.
Point of Control & Value Areas
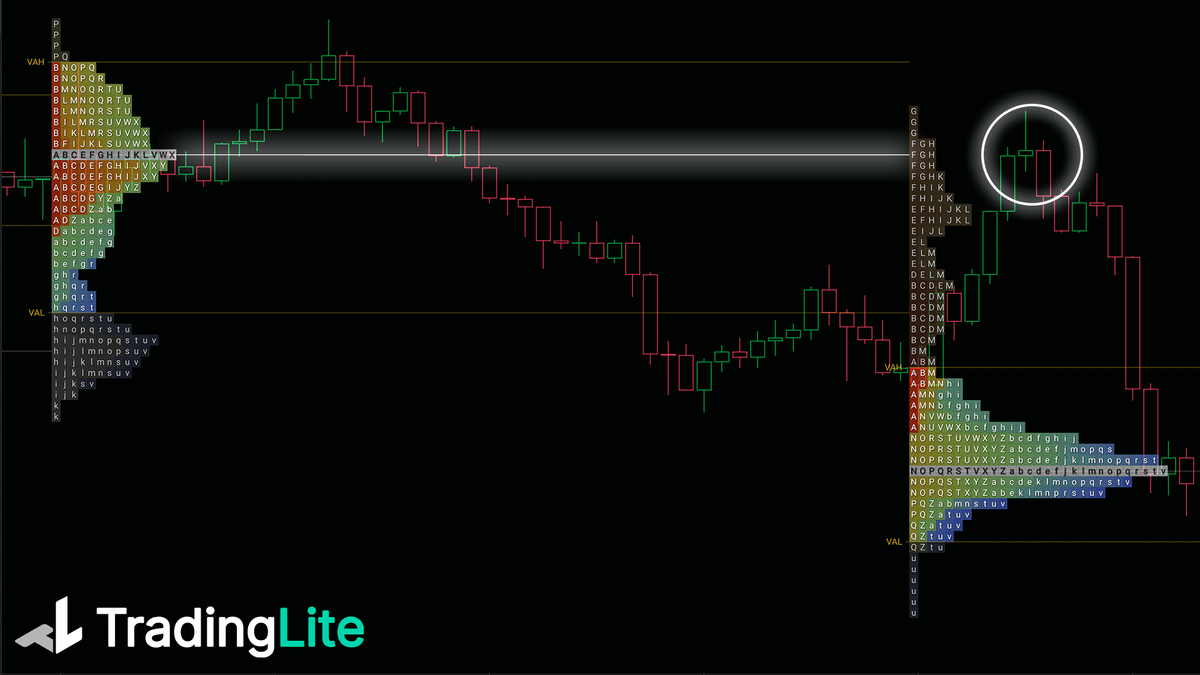
Rather than subjectively drawn support and resistance, Market Profile's Point of Control and Value Areas are based purely upon the duration of market activity at various price levels. Therefore, it could be argued that these POCs and VAs may be more statistically significant as possible areas of support and resistance.

Once a POC is formed, price can sometimes gravitate to these levels in future sessions. To make this previously established easily identifiable in the future, POC rays can be indefinitely extended in TradingLite. These are called 'Naked' POCs (or NPOCs). The render will continue until touches these NPOCs. For a full list of Point of Control configurations, see the TPO / Market Profile Basics guide.
Initial Balances
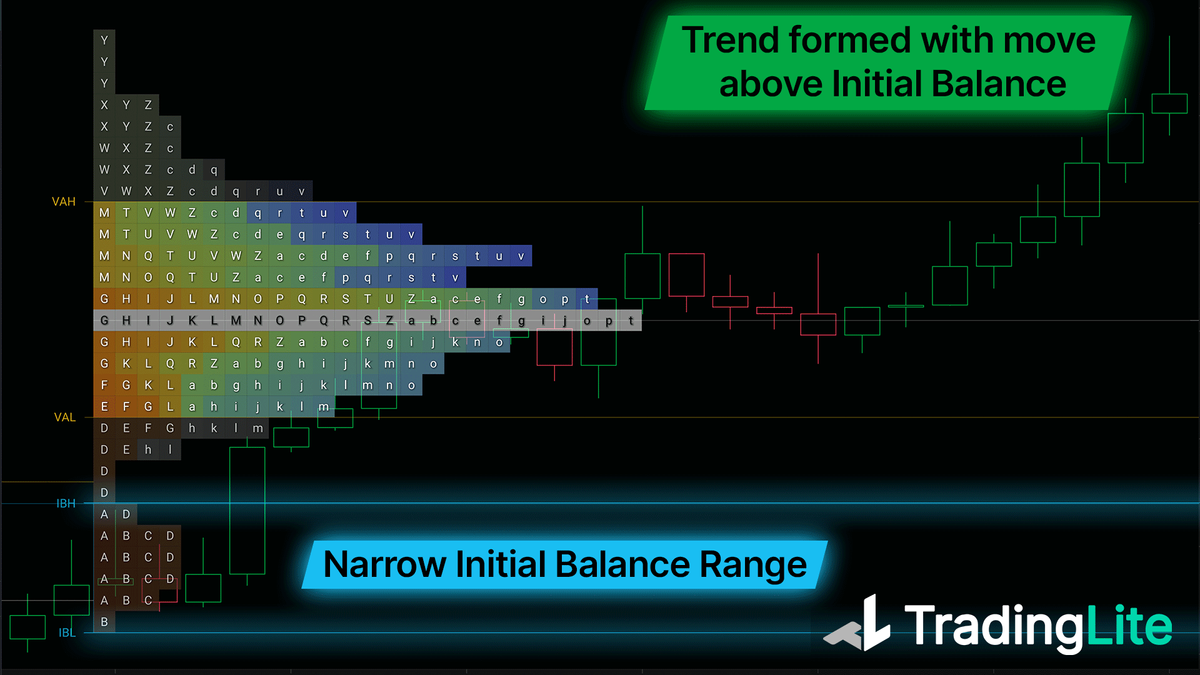
Market Profile theory was originally developed for legacy markets, with set open and closing times. This meant that the first hour of trading (2 x 30 min periods) were often an important gauge of how the remainder of the session may develop. With 24/7 cryptocurrency markets, the Initial Balance is usually considered as 00:00 to 01:00 UTC.
Four commonly practiced principles of Initial Balance:
If price moves below the IB range, it may indicate sellers are in control.
If price moves above the IB range, it may indicate buyers are in control.
A large IB range can often indicate the session may trade within a range.
A small IB range can often indicate the session may form a general trend.

Given that some cryptocurrency traders will trade within legacy market hours, TradingLite provides the ability to choose to render TPOs for specific session, in addition to full 24 hour session. For a full list of Session configurations, see the TPO / Market Profile Basics guide.
Single Prints
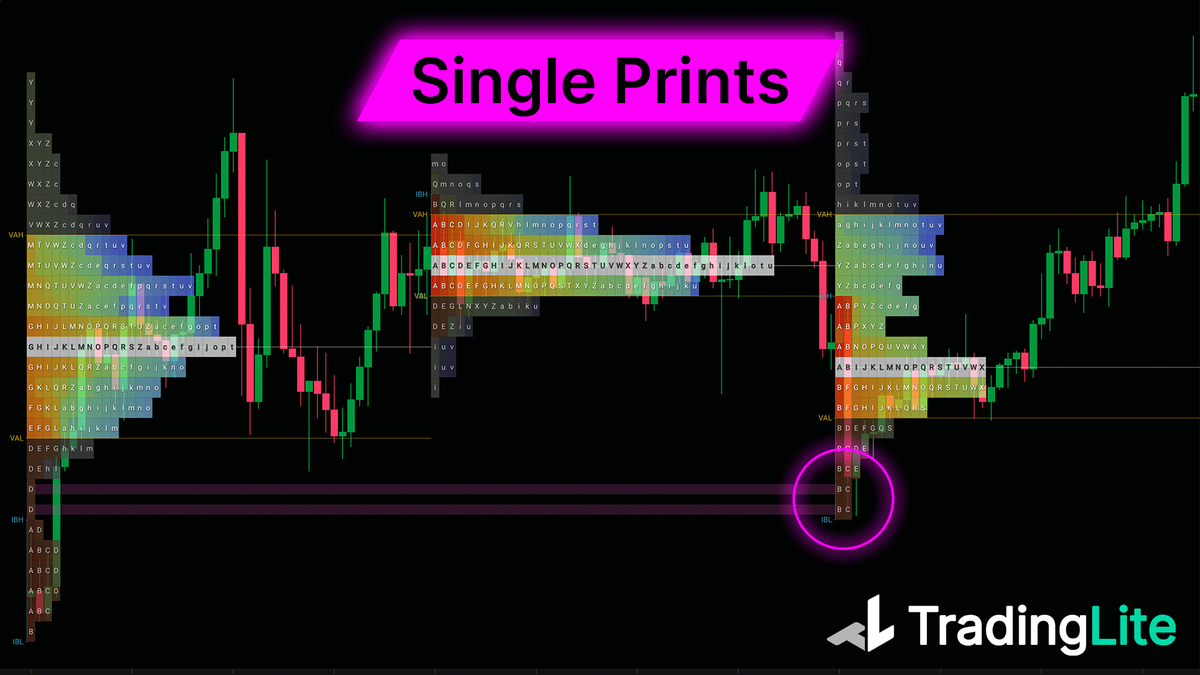
Similar in application of Point of Controls, Single Prints can often identify where price may gravitate towards in future. As Single Prints are only formed on a fast movement of price - due to an inefficiency of buyers and sellers at that particular price level - these levels are often re-tested by market participants in the future - in an attempt to correct this inefficiency.

TradingLite allows you to easily identify these Single Print levels by rendering a colored ray that will extend indefinitely until price re-tests these levels. For a full list of Single Print configurations, see the TPO / Market Profile Basics guide.
Was this page helpful?