First Summer Update
The first update of the Summer is finally here bringing you a number of new features, improvements and bug-fixes!

We know it's been a little longer than usual since our last update, and yes we did miss out on our monthly blog posts but rest assured, we’ve been hard at work making the TradingLite experience as close to a native app as possible.
Rather than push out a bunch of new features that we have been working on as one major update, we will be returning to our previous regular release flow. After 800+ changes and over hundreds of tests, we’re finally proud to release this to the public!
As usual, the full list of features, improvements and bug-fixes can be found in-app (there are over 50!), however below are some of the ones we're most excited about!
# Built-in Indicator Improvements
# New VPSV Layer
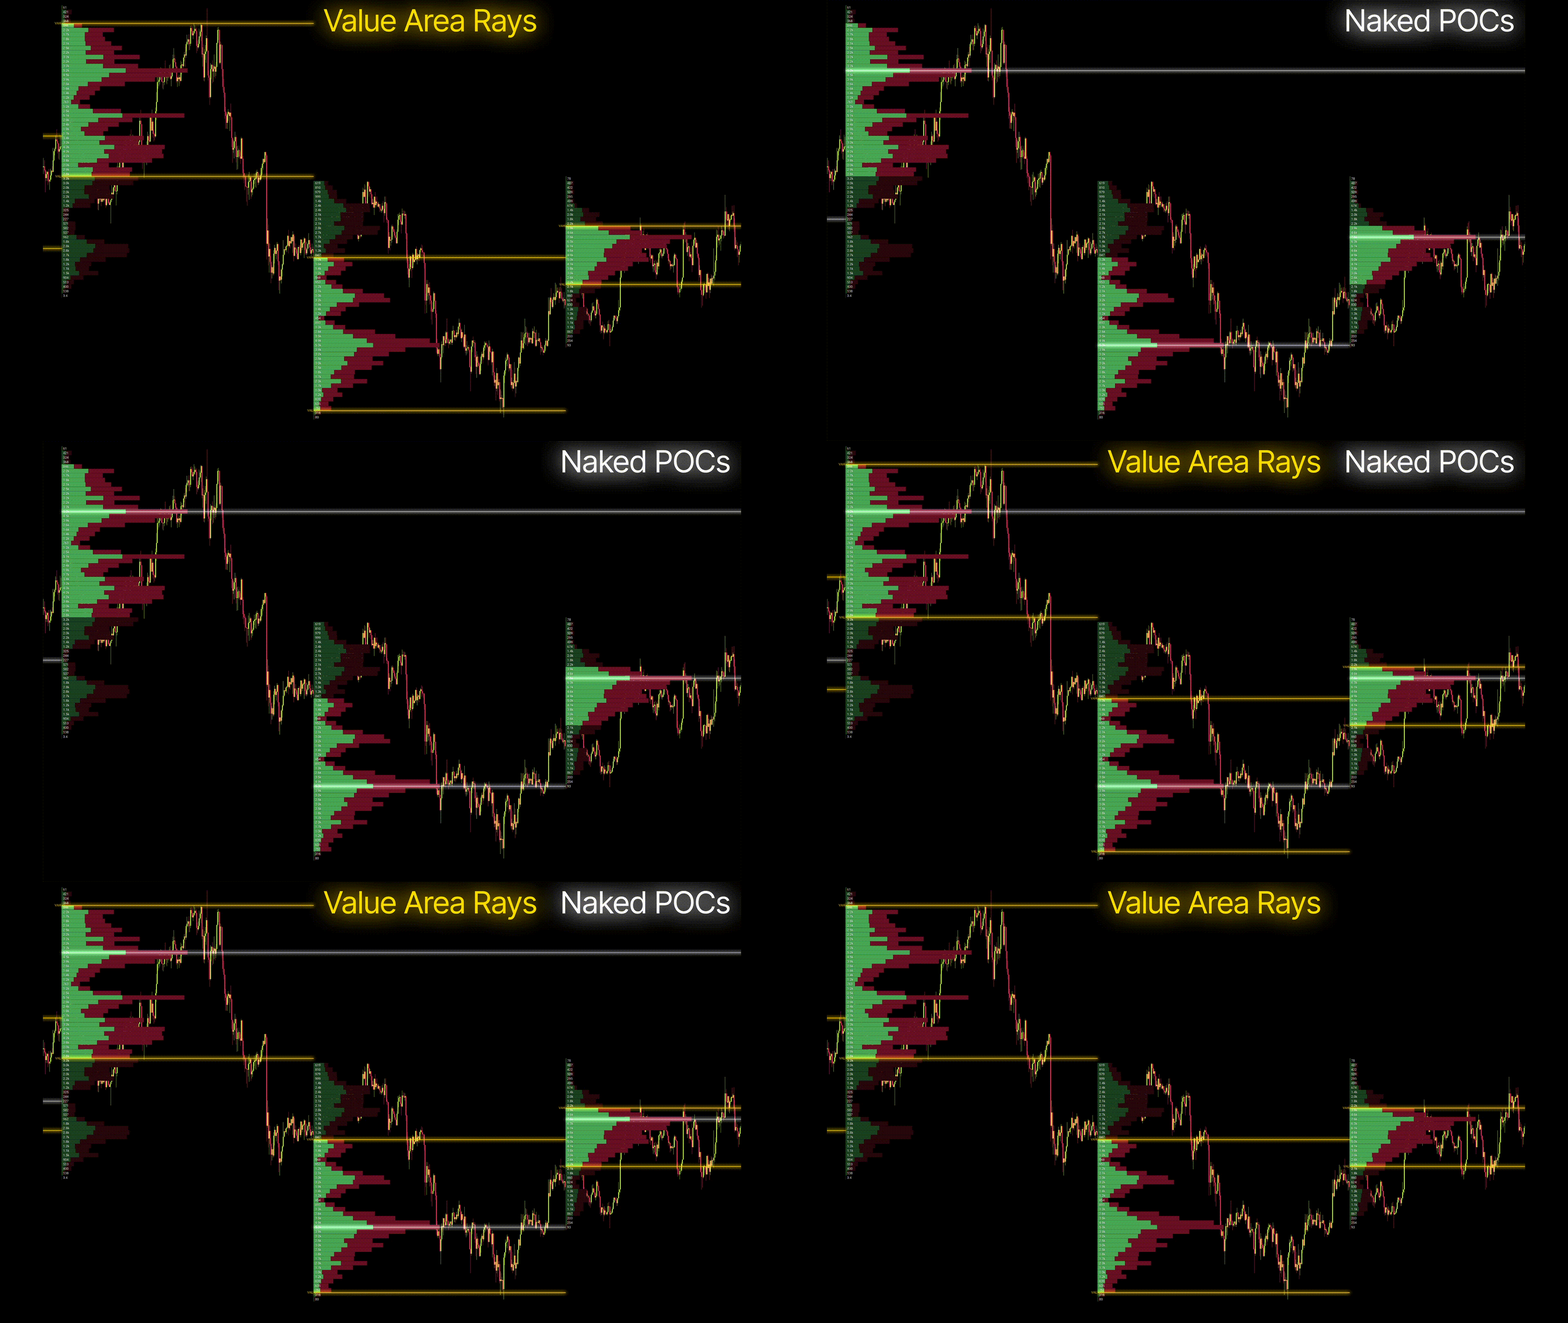
We've completely re-designed VPSV layer now offers a variety of new features to aid in your trading.
# Point of Control
Whilst maintaining all of the previous choices, the Point of Control has a variety of new styles. This including the much requested Naked Extension option! This will extend the POC of previous profiles indefinitely until price proceeds to rest these levels in future.
# Session Splits
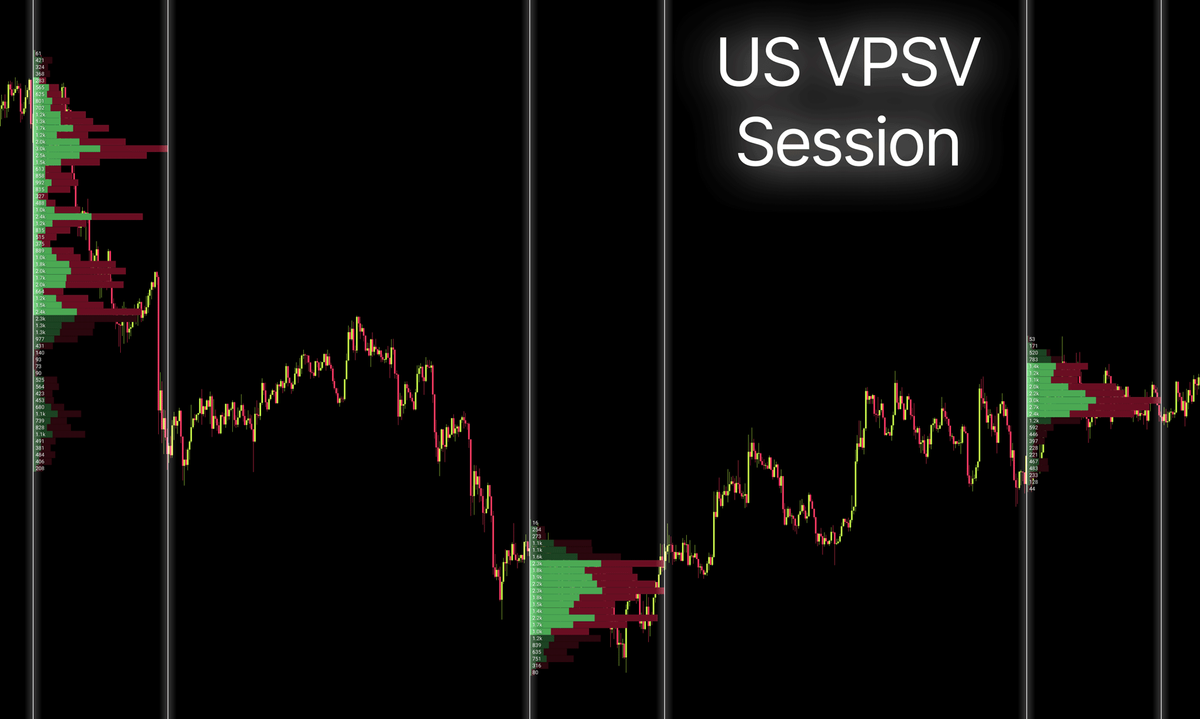
Rather than pre-definition of what constitutes a 'Session', which was ultimately controlled by the time-frame selected, you now have a range of options across all intervals! Asia, Europe and US legacy market session times are now available, along with a choice of set periods.
# Value Area
Previously, the render of the Value Area was only darkened in comparison with the rest of the profile. Also the VA itself was predefined. This update brings you the ability to define both the input and style of the Value Area.
Whilst we have already re-worked a bunch of the other Official Indicators, this is the first one we are releasing into the wild. Stay tuned on our Twitter and Discord for when the rest are added. They are coming very soon, we promise!
# TradingLite Standalone App
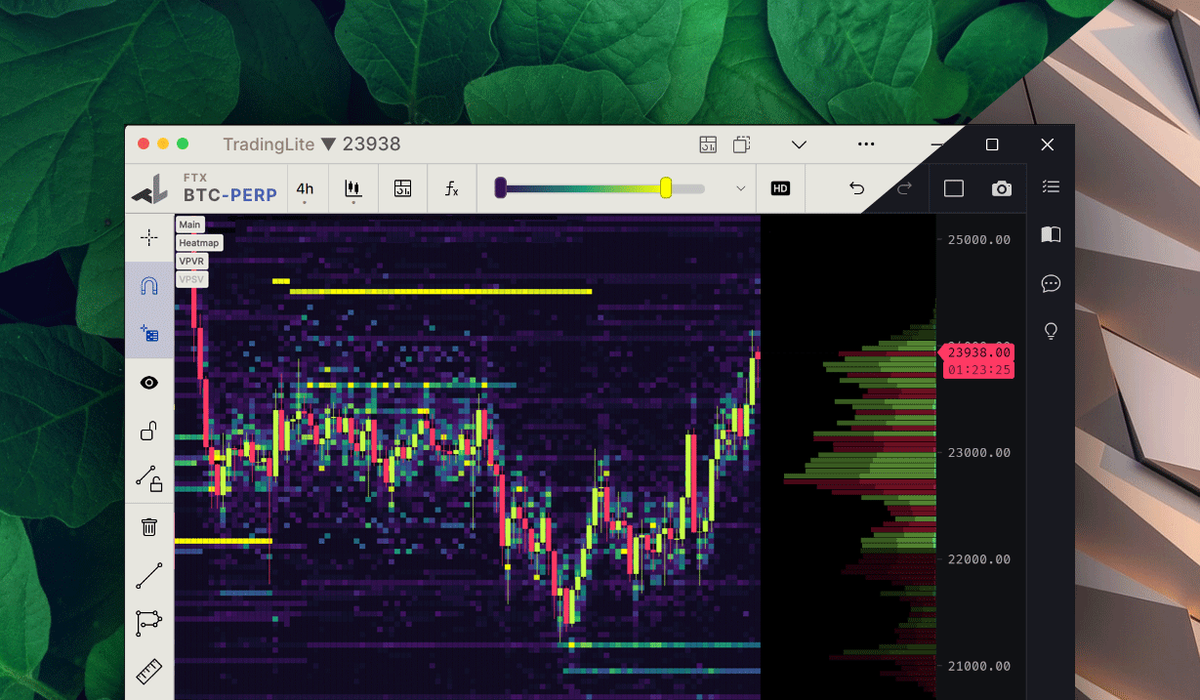
We’ve made the standalone app experience so natural and great, that we’ve been using it ourselves for most of our development and testing. The great thing about having TL as a standalone app, is how good it looks and feels, seamlessly integrating with the rest of your operating system, while providing the modern browser’s excellent security sandbox and safety. For those who choose to install TradingLite ( see how you can install it today), you will barely notice it’s even running inside a browser.
# Multi-Window Support (Standalone app)
Not all browsers support this feature yet, but for those that do, you will have the option to use our new custom title bar, which will includes some very handy shortcuts.

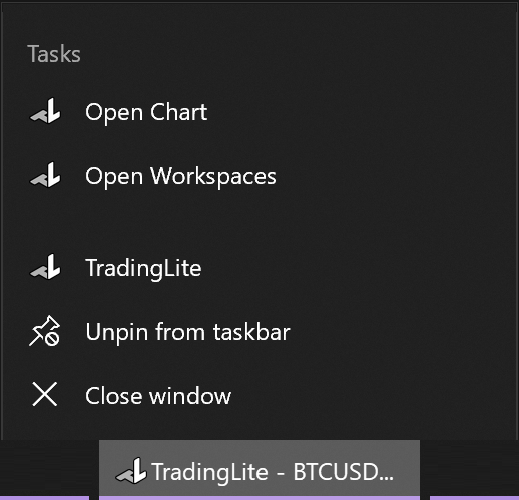
In addition, we also included few useful right-click shortcuts for the app.
# TradingLite Core Changes
# Reduced Delay, more Speed and Oomph
We live in 2022, and disabling actions such as changing market or timeframe while data was loading hindered your overall experience. We've redesigned major parts of TradingLite to give you a smoothly graceful and effortless interactive experience.
For low-end devices, many parts of TradingLite will feel faster, and in-case you added a Litscript indicator that relies on some very heavy calculations, we will prevent it from freezing the app.
Crypto's favourite Heatmap has had another performance boost whilst also reducing its memory footprint by another 25%! Yes, we are impressed too!
# Accessibility Improvements
TradingLite's biggest asset, is you, our community of users. Therefore when we heard some of you were sometimes having difficulty using our platform due to some visual impairments, we made it a priority to focus on this area.
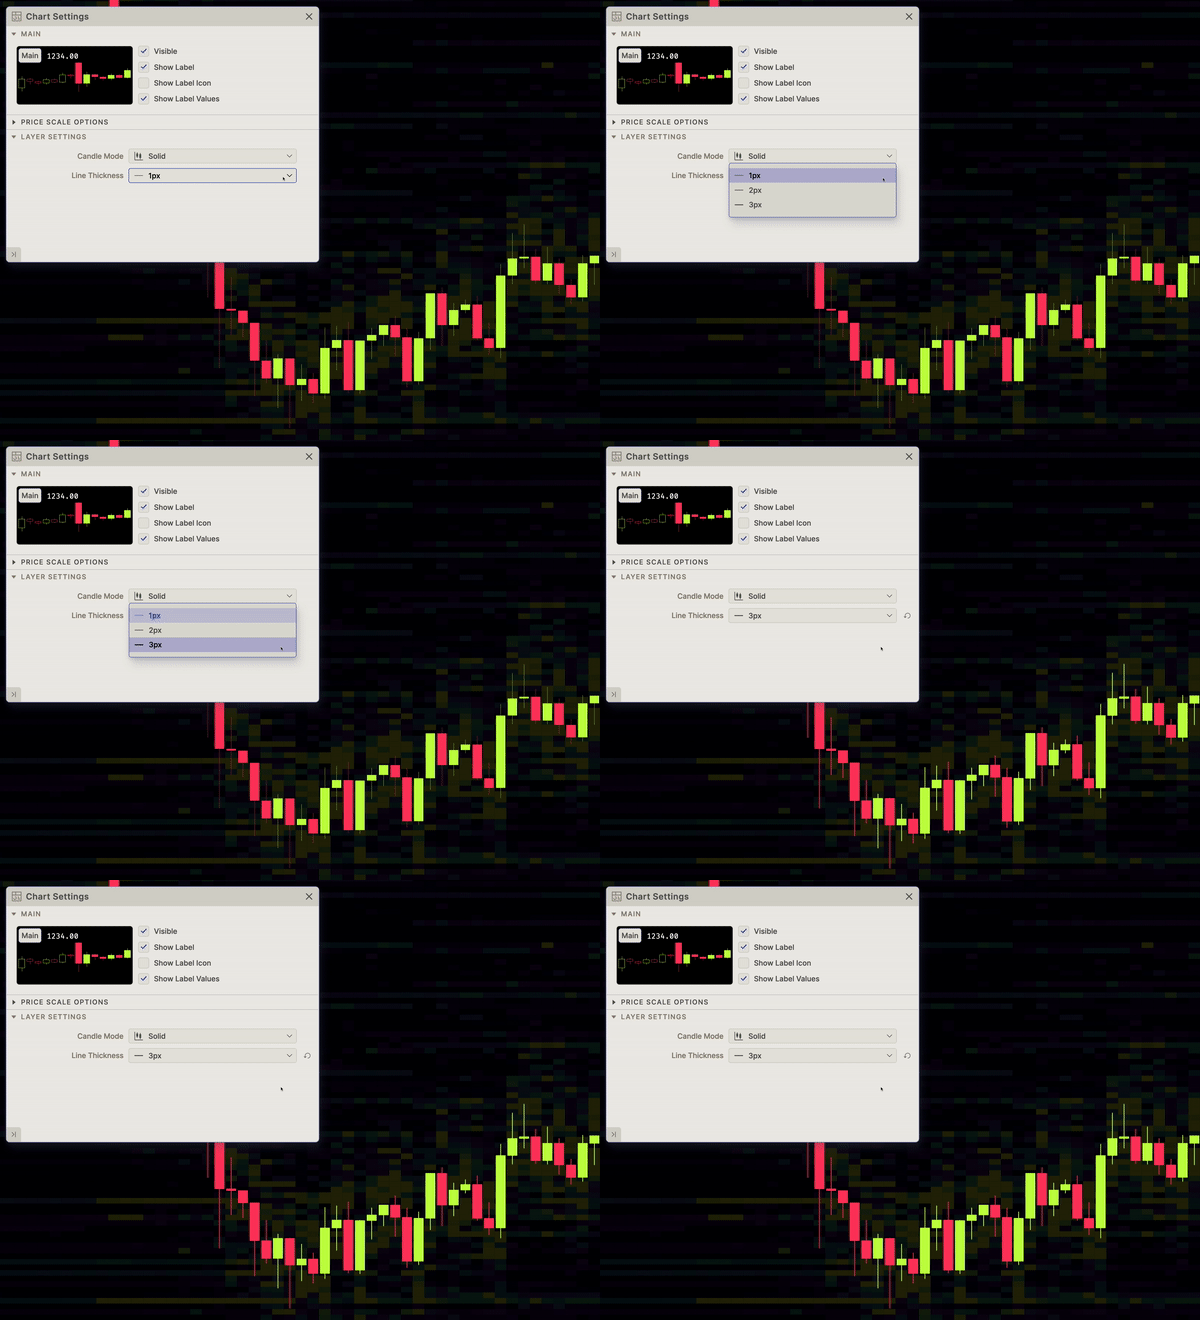
# Candle Border Line Thickness
Out of the few members of the community who struggled visually with TradingLite, a frequent issue raised by those with impairments, was the difficulty at times to view candles. This update brings you the ability to select the thickness in pixels of the candle's borders.
# New Heatmap Transparency
As the catalog of community indicators grows each week (Over 400 at the time of posting), the Heatmap render can sometimes overpower the chart as a whole. This can make the work of our growing Litscript army difficult to see. Therefore, a new Heatmap Transparency option has been added.
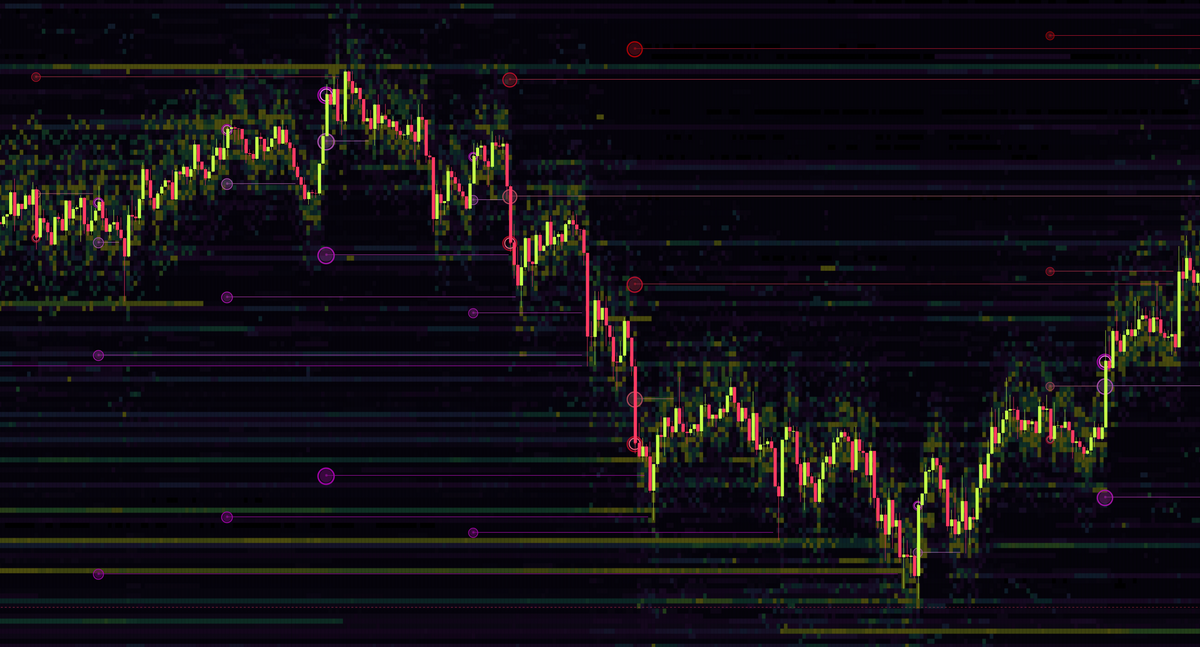
The transparency feature aims to help visually separate indicators such as Liquidation Levels that render horizontal rays from the boldness of the Heatmap itself.
Gone are the days where you would touch a button and it would keep its hover colors until you pressed somewhere else. This made sometimes things confusing especially when the hover color of a button and toggle color (such as enabling crosshair magnet) are identical. Through some rigorous testing and experimentation on various devices and platforms, we've ensured that the all the interactive elements behave, the way you would expect them to.
# Summer-Proof Light Theme
By placing one of our engineers in direct sunlight during the brightest of the hours of the day and forcing them to use TradingLite, we succeeded in making the Light Themed TradingLite even more readable than before. Plenty of tweaks here and there to make this theme summer-proof.
# Copy Paste Anywhere!
Previously it copy pasting a layout, pane, layer or theme between different tabs, workspaces or devices was a tedious process, requiring the use of Layout & Theme Source editor and basic knowledge of JSON. We’ve improved this by making the data actually be copied to your clipboard! No need to use the Source editor anymore, with this new feature including additional validations and checks, we made sure to minimize the amount of common mistakes that could occur.
How does this work? Well, try right-click Copy of something inside the chart settings, then Paste it in another window. It’s that simple!
# In the works currently...
It may be summer, but the whole team at TradingLite is as busy as ever working on the next juicy update as we speak. We had quite a bit of prep-work that had to be designed, built, and tested for future features, which is partly the delay in this update. Good news is we completed the boring (but very important) parts, now time to move to the fun part!
# Indicator of the month
What blog post would be complete without our indicator of the month award! This month goes to Four for their Volume Rotations indicator.
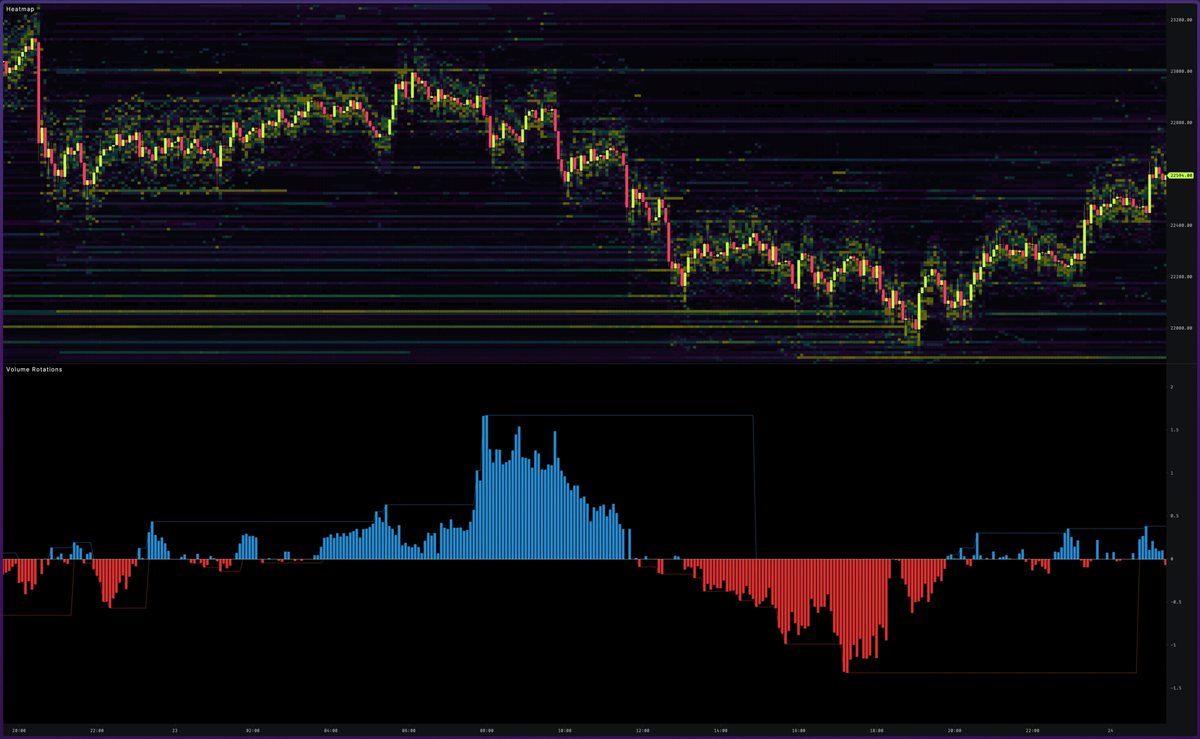
This script plots the difference between the normalized change in buying/selling volume and the change in price. The rotations end when there is a significant value in the opposite direction.