Chartist Update

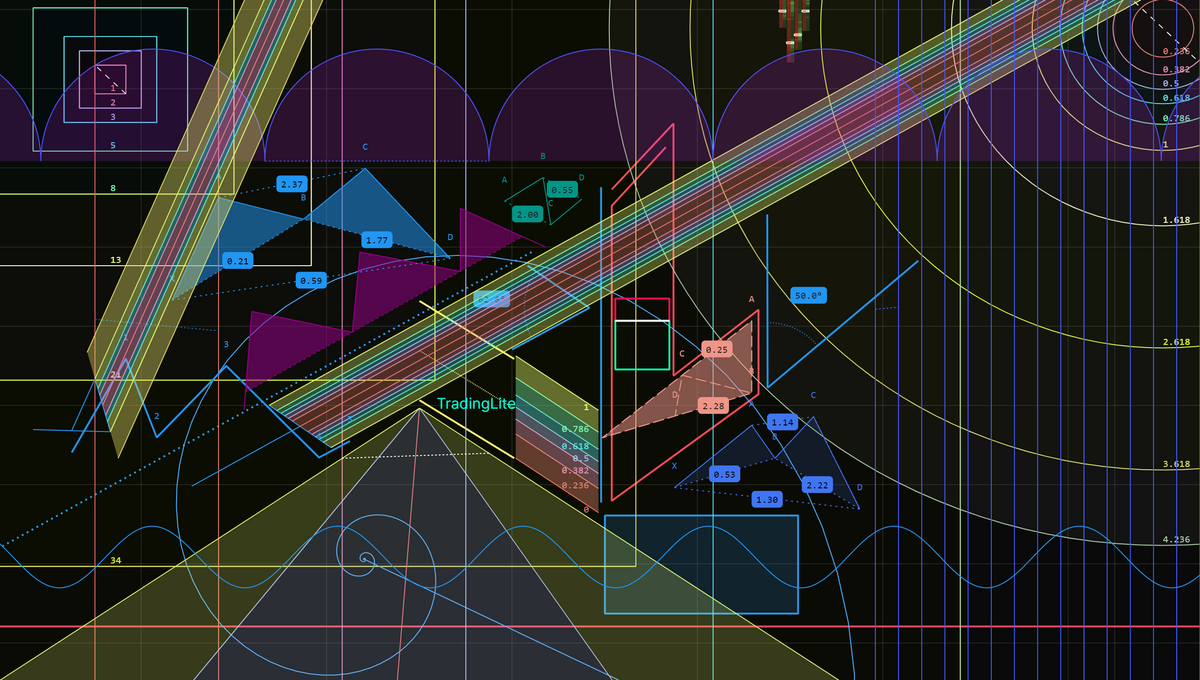
Late February brings a slew of new drawing tools to TradingLite! All of your current favourites have been refined and the boat-load of new tools should keep even the most particular of chartists satisfied! From Fibonacci fanatics to Elliot Wave evangelists, rejoice!
This drawing focused update brings over 30 new tools to your TradingLite chart. We will be providing some documentation on each one in the future, but for now here is the full list of all of the new drawing tools:
Tools
Ray
Horizontal Line
Trend Angle
Multi-point Path
Fibonacci
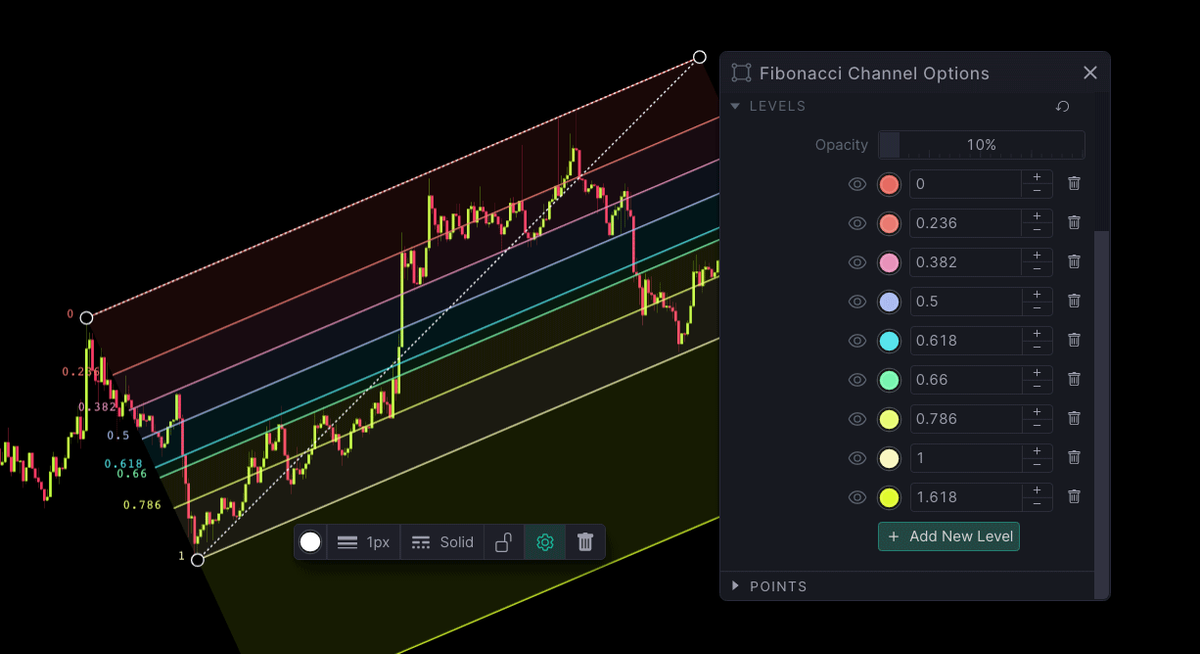
Fibonacci Channel
Fibonacci Spiral
Fibonacci Circles
Fibonacci Boxes
Fibonacci Time Zone
Patterns
ABCD Pattern
Head and Shoulders
Triangle Pattern
Three Drives Pattern
XABCD Pattern
Cypher Pattern
Repeating Patterns
Sine Wave
Time Cycles
Cyclic Lines
Pitchforks
Fans
Elliot Waves
# Full Drawing Customisation
Customisation, is as critical as the drawing itself. All of TradingLite's drawings are now configurable to your preferences. This includes custom fibonacci and pitchfork levels with choice of fill and line colors, and finally point values are configurable for Risk/Reward tool.

# Direction & Angle Snapping
As part of this update, you now have the ability create drawings with pin-point accuracy, quickly and efficiently. After selecting a drawing tool, Holding 'Shift' on your keyboard will produce the Direction & Angle snapping interface.
As you move your mouse, you will notice the how your drawing points will snap between 45 degree angles. This is particularly useful when creating parallel or perpendicular drawing.
# Stay in Drawing Mode
Plotting multiple drawings of the same type? The Stay in Drawing Mode button has you covered. Simply toggle the button in your drawing toolbar, and start creating your drawings, uninterrupted.

# New Additions & Updates
Although drawings tools have been the primary focus of this update, there are a few more minor new additions and updates.
Hovering over the Order Book you will notice a new tool-tip to help you quickly calculate percentage between the highlighted, and current price.
# New: Sessions Layers
A new addition to TradingLite's Official Indicators, the Sessions Layer renders vertical lines to show the traditional finance market hours. The open and close of Asia, Europe and US market hours can colored to your preference.
# Update: LitScript Length
As our community grows, so does our arsenal of LitScript Indicators. Whilst we had thought 10,000 characters would be more than enough, some of our top authors were looking for a bit more room to flex their creativity, we are looking at you Vik. We have upped this hard limit.
# Update: Grid Layer
Another simple quality of life improvement, the Grid Layer can now be configured to disable just horizontal or vertical lines.
# Update: Various Fixes
We are starting to get into the minutiae now, but this update includes a number of fixes to minor niggling issues. See the full changelog in-app.